|
Contents
Elementary Human Genetics
Population Genetics
Physical Anthropology
The Central Asian Gene Pool
The Karakalpak Gene Pool
Discussion and Conclusions
Postscript
References
Elementary Human Genetics
Every human is defined by his or her library of genetic material, copies of which are stored in every cell of the
body apart from the red blood cells. Cells are classified as somatic, meaning body cells, or gametic, the cells
involved in reproduction, namely the sperm and the egg or ovum. The overwhelming majority of human genetic material
is located within the small nucleus at the heart of each somatic cell. It is commonly referred to as the human genome.
Within the nucleus it is distributed between 46 separate chromosomes, two of which are known as the sex chromosomes.
The latter occur in two forms, designated X and Y. Chromosomes are generally arranged in pairs - a female has 22 pairs
of autosome chromosomes plus one pair of X chromosomes, while a male has a similar arrangement apart from
having a mixed pair of X and Y sex chromosomes.
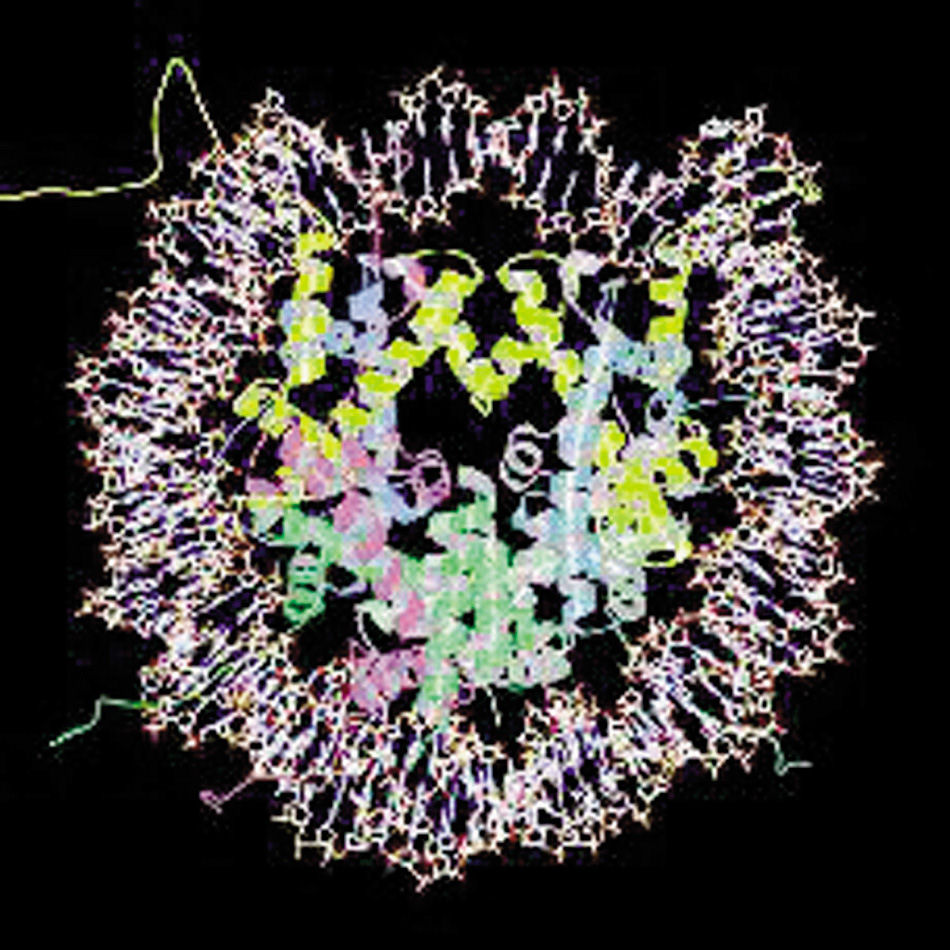
A neutron crystallography cross-sectional image of a chromosome, showing the double
strand of DNA wound around a protein core.
Image courtesy of the US Department of Energy Genomics Program
A single chromosome consists of just one DNA macromolecule composed of two separate DNA strands, each of which contains
a different but complementary sequence of four different nucleotide bases - adenine (A), thymine (T), cytasine (C), and
guanine (G). The two strands are aligned in the form of a double helix held together by hydrogen bonds, adenine always
linking with thymine and cytasine always linking with guanine. Each such linkage between strands is known as a base pair.
The total human genome contains about 3 billion such base pairs. As such it is an incredibly long molecule that could be
from 3 cm to 6 cm long were it possible to straighten it. In reality the double helix is coiled around a core of structural
proteins and this is then supercoiled to create the chromosome, 23 pairs of which reside within a cell nucleus with a
diameter of just 0.0005 cm.
A gene is a segment of the DNA nucleotide sequence within the chromosome that can be chemically read to make one specific
protein. Each gene is located at a certain point along the DNA strand, known as its locus. The 22 autosome chromosome pairs
vary in size from 263 million base pairs in chromosome 1 (the longest) down to about 47 million base pairs in chromosome 21
(the shortest - chromosome 22 is the second shortest with 50 million base pairs), equivalent to from 3,000 down to 300 genes.
The two sex genes are also very different, X having about 140 million base pairs and expressing 1,100 genes, Y having only
23 million base pairs and expressing a mere 78 genes. The total number of genes in the human genome is around 30,000.
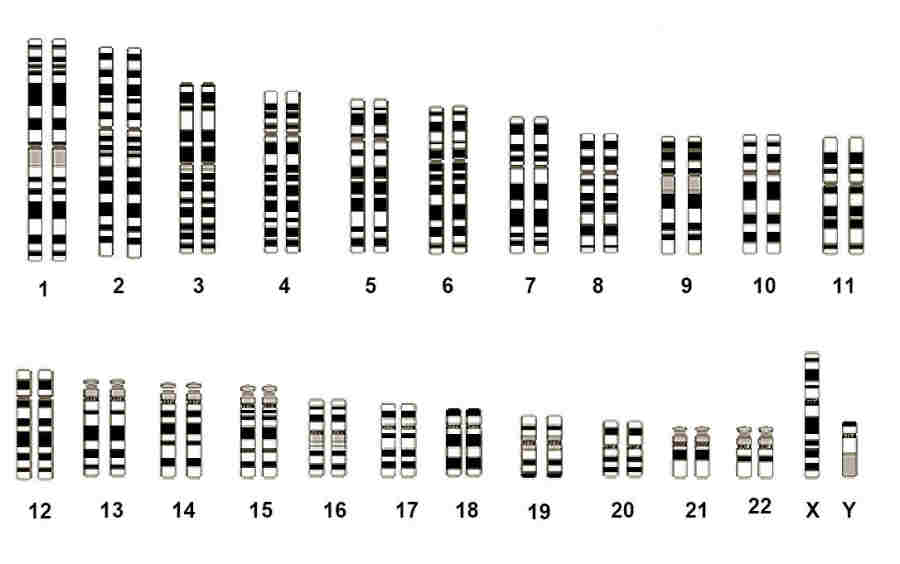
|
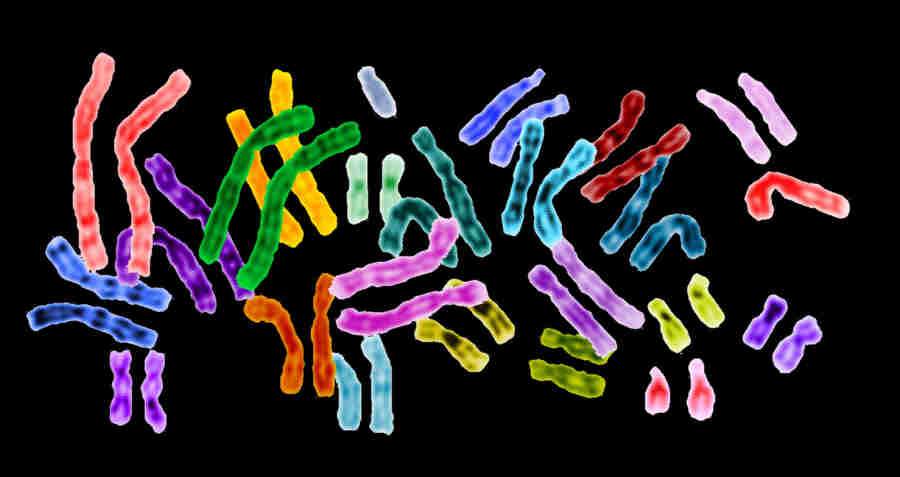
A complete set of 23 human homologous chromosome pairs
Image courtesy of the National Human Genome Research Institute, Maryland
Each specific pair of chromosomes have their own distinct characteristics and can be identified under the microscope after
staining with a dye and observing the resulting banding. With one exception the chromosome pairs are called homologous because
they have the same length and the same sequence of genes. For example the 9th pair always contain the genes for melanin
production and for ABO blood type, while the 14th pair has two genes critical to the body's immune response. Even so the
individual chromosomes within each matching pair are not identical since each one is inherited from each parent. A certain
gene at a particular locus in one chromosome may differ from the corresponding gene in the other chromosome, one being dominant
and the other recessive. The one exception relates to the male sex chromosomes, a combination of X and Y, which are not the same
length and are therefore not homologous.
A set of male human chromosomes showing typical banding
Various forms of the same gene (or of some other DNA sequence within the chromosome) are known as alleles. Differences in DNA
sequences at a specific chromosome locus are known as genetic polymorphisms. They can be categorized into various types, the
most simple being the difference in just a single nucleotide - a single nucleotide polymorphism.
When a normal somatic cell divides and replicates, the 23 homologous chromosome pairs (the genome) are duplicated through a
complex process known as mitosis. The two strands of DNA within each chromosome unravel and unzip themselves in order to
replicate, eventually producing a pair of sister chromatids - two brand new copies of the original single chromosome joined together.
However because the two chromosomes within each homologous pair are slightly different (one being inherited from each parent)
the two sister chromatids are divided in two. The two halves of each sister chromatid are allocated to each daughter cell,
thus replicating the original homologous chromosome pair. Such cells are called diploid because they contain two (slightly different)
sets of genetic information.
The production of gametic cells involves a quite different process. Sperm and eggs are called haploid cells, meaning single,
because they contain only one set of genetic information - 22 single unpaired chromosomes and one sex chromosome. They are formed
through another complex process known as meiosis. It involves a deliberate reshuffling of the parental genome in order
to increase the genetic diversity within the resulting sperm or egg cells and consequently among any resulting offspring.
As before each chromosome pair is replicated in the form of a pair of sister chromatids. This time however, each half of each
chromatid embraces its opposite neighbour in a process called synapsis. An average of two or three segments of maternal and
paternal DNA are randomly exchanged between chromatids by means of molecular rearrangements called crossover and genetic recombination.
The new chromatid halves are not paired with their matching partners but are all separated to create four separate haploid cells,
each containing one copy of the full set of 23 chromosomes, and each having its own unique random mix of maternal and paternal DNA.
In the male adult this process forms four separate sperm cells, but in the female only one of the four cells becomes an ovum, the
other three forming small polar bodies that progressively decay.
During fertilization the two haploid cells - the sperm and the ovum or egg - interact to form a diploid zygote (zyg meaning
symetrically arranged in pairs). In fact the only contribution that the sperm makes to the zygote is its haploid nucleus containing
its set of 23 chromosomes. The sex of the offspring is determined by the sex chromosome within the sperm, which can be either
X (female) or Y (male). Clearly the sex chromosome within the ovum has to be X. The X and the Y chromosomes are very different,
the Y being only one third the size of the X. During meiosis in the male, the X chromosome recombines and exchanges DNA with
the Y only at its ends. Most of the Y chromosome is therefore unaffected by crossover and recombination. This section is known
as the non-recombining part of the Y chromosome and it is passed down the male line from father to son relatively unchanged.
|
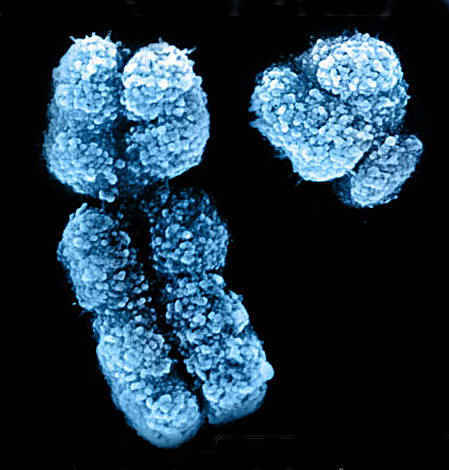
Scanning electron micrograph of an X and Y chromosome
Image courtesy of Indigo Instruments, Canada
Not all of the material within the human cell resides inside the nucleus. Both egg and sperm cells contain small energy-producing
organelles within the cytoplasm called mitochondria that have their own genetic material for making several essential mitochondrial
proteins. However the DNA content is tiny in comparison with that in the cell nucleus - it consists of several rings of DNA totalling
about 16,500 base pairs, equivalent to just 13 genes. The genetic material in the nucleus is about 300,000 times larger. When
additional mitochondria are produced inside the cell, the mitochondrial DNA is replicated and copies are transferred to the
new mitochondria. The reason why mitochondrial DNA, mtDNA for short, is important is because during fertilization virtually no
mitochondria from the male cell enters the egg and those that do are tagged and destroyed. Consequently the offspring only inherit
the female mitochondria. mtDNA is therefore inherited through the female line.
Population Genetics
Population genetics is a branch of mathematics that attempts to link changes in the overall history of a population to changes in
its genetic structure, a population being a group of interbreeding individuals of the same species sharing a common geographical
area. By analysing the nature and diversity of DNA within and between different populations we can gain insights into their
separate evolution and the extent to which they are or are not related to each other. We can gain insights into a population's
level of reproductive isolation, the minimum time since it was founded, how marriage partners were selected, past geographical
expansions, migrations, and mixings.
The science is based upon the property of the DNA molecule to occasionally randomly mutate during replication, creating the possibility
that the sequence of nucleotides in the DNA of one generation may differ slightly in the following generation. The consequence of
this is that individuals within a homogenous population will in time develop different DNA sequences, the characteristic that we
have already identified as genetic polymorphism. Because mutations are random, two identical but isolated populations will tend
to change in different directions over time. This property is known as random genetic drift and its effect is greater in smaller
populations.
To study genetic polymorphisms, geneticists look for specific genetic markers. These are clearly recognizable mutations in the
DNA whose frequency of incidence varies widely across populations from different geographical areas. In reality the vast majority
of human genetic sequences are identical, only around 0.1% of them being affected by polymorphisms.
There are several types of genetic marker. The simplest are single nucleotide polymorphisms (SNPs), mentioned above, where just
one nucleotide has been replaced with another (for example A replaces T or C replaces G). SNPs in combination along a stretch of DNA
are called haplotypes, shorthand for haploid genotypes. These have turned out to be valuable markers because they are genetically
relatively stable and are found at differing frequencies in many populations. Some are obviously evolutionarily related to each
other and can be classified into haplogroups (Hg). Another type of polymorphism is where short strands of DNA have been randomly
inserted into the genetic DNA. This results in so-called biallelic polymorphism, since the strand is either present or absent. These
are useful markers because the individuals that have the mutant insert can be traced back to a single common ancestor, while those
who do not have the insert represent the original ancestral state . Biallelic polymorphisms can be assigned to certain haplotypes.
A final type of marker is based upon microsatellites, very short sequences of nucleotides, such as GATA, that are repeated in tandem
numerous times. A polymorphism occurs if the number of repetitions increases or decreases. Microsatellite polymorphisms, sometimes
also called short-tandem-repeat polymorphisms, occur more frequently over time, providing a different tool to study the rate of
genetic change against time.
Of course the whole purpose of sexual reproduction is to deliberately scramble the DNA from both parents in order to create
a brand new set of chromosome pairs for their offspring that are not just copies of the parental chromosomes. Studies show
that about 85% of genetic variation in autosomal sequences occurs within rather than between populations.
However it is the genetic variation between populations that is of the greatest interest when we wish to study their history.
Because of this, population geneticists look for more stable pieces of DNA that are not disrupted by reproduction. These are
of two radically different types, namely the non-recombining part of the Y chromosome and the mitochondrial DNA or mtDNA. A
much higher 40% of the variations in the Y chromosome and 30% of the variations in mtDNA are found between populations. Each
provides a different perspective on the genetic evolution of a particular population.
Y Chromosome Polymorphisms
By definition the Y chromosome is only carried by the male line. Although smaller than the other chromosomes, the Y chromosome
is still enormous compared to the mtDNA. The reason that it carries so few genes is because most of it is composed of "junk" DNA.
As such it is relatively unaffected by natural selection. The non-recombining part of the Y chromosome is passed on from father
to son with little change apart from the introduction of genetic polymorphisms as a result of random mutations. The only
problem with using the Y chromosome to study inheritance has been the practical difficulty of identifying a wide range
of polymorphisms within it, although the application of special HPLC techniques has overcome some of this limitation in recent years.
Y chromosome polymorphisms seem to be more affected by genetic drift and may give a better resolution between closely related
populations where the time since their point of divergence has been relatively short.
mtDNA Polymorphisms
By contrast the mtDNA is carried by the female line. Although less than one thousandth the size of the DNA in the non-recombinant
Y chromosome, polymorphisms are about 10 times more frequent in mtDNA than in autosome chromosomes.
Techniques and Applications
Population genetics is a highly statistical science and different numerical methods can be used to calculate the various properties of
one or several populations. Our intention here is to cover the main analytical tools used in the published literature relating to
Karakalpak and the other Central Asian populations.
The genetic diversity of a population is the diversity of DNA sequences within its gene pool. It is calculated by a statistical
method known as the analysis of molecular variance (AMOVA) in the DNA markers from that population. It is effectively a summation of the
frequencies of individual polymorphisms found within the sample, mathematically normalized so that a diversity of 0 implies all the
individuals in that population have identical DNA and a diversity of 1 implies that the DNA of every individual is different.
The genetic distance between two populations is a measure of the difference in their polymorphism frequencies. It is calculated
statistically by comparing the pairwise differences between the markers identified for each population, to the pairwise
differences within each of the two populations. This distance is a multi-dimensional not a linear measure. However it is normally
illustrated graphically in two dimensions. New variables are identified by means of an angular transformation, the first two of which
together account for the greatest proportion of the differences between the populations studied.
Another property that can be measured statistically is kinship - the extent to which members of a population are related to
each other as a result of a common ancestor. Mathematically, a kinship coefficient is the probability that a randomly sampled
sequence of DNA from a randomly selected locus is identical across all members of the same population. A coefficient of 1
implies everyone in the group is related while a coefficient of 0 implies no kinship at all.
By making assumptions about the manner in which genetic mutations occur and their frequency over time it is possible to work backwards
and estimate how many generations (and therefore years) have elapsed from the most recent common ancestor, the individual to
whom all the current members of the population are related by descent. This individual is not necessarily the founder of the
population. For example if we follow the descent of the Y chromosome, this can only be passed down the male line from father to son.
If a male has no sons his non-combining Y chromosome DNA is eliminated from his population for ever more. Over time, therefore, the
Y chromosomes of the populations ancestors will be progressively lost. There may well have been ancestors older than the most recent
common ancestor, even though we can find no signs for those ancestors in the Y chromosome DNA of the current population.
A similar situation arises with mtDNA in the female half of the population because some women do not have daughters.
Physical Anthropology
In 1977 the American anthropologist Gordon T. Bowles published an analysis of the anthropometric characteristics of 519 different
populations from across Asia, including the Karakalpaks and two regional groups of Uzbeks. Populations were characterized by 9
standard measurements, including stature and various dimensions of the head and face. A multivariate analysis was used to separate the
different populations by their physical features.
Bowles categorized the populations across four regions of Asia (West, North, East, and South) into 19 geographical groups. He then
analysed the biological distances between the populations within each group to identify clusters of biologically similar peoples.
Central Asia was divided into Group XVII encompassing Mongolia, Singkiang, and Kazakhstan and Group XVIII encompassing Turkestan and
Tajikistan. Each Group was found to contain three population clusters:
Anthropological Cluster Analysis of Central Asia
| Group | Cluster | Regional Populations |
| XVII | 1 | Eastern Qazaqs
Alai Valley Kyrgyz | Buryat
Nivkhi (Gilyak) |
| 2 | Aksu Rayon Uighur
Alma Ata Uighur
Steppe Qazaqs |
Alma Ata Qazaqs
Ferghana Kyrgyz
|
| 3 | Kumyk
Nogai
Kalmuk Sarts
Khalka Mongols |
Eastern Mongols
T'ien Shan Kyrgyz
Sayak Kyrgyz
Nanay (Goldi) |
| XVIII | 1 | Karakalpaks
Samarkand Uzbeks |
Tashkent Uzbeks
|
| 2 | Pamiri Tajiks
Yagnobi Tajiks
Karategin Takijs |
Surkhan Tajiks
Kipchak Kyrgyz
|
| 3 | Yomut Turkmen
Merv Turkmen |
Total Turkmen
|
Within geographical Group XVIII, the Karakalpaks clustered with the Uzbeks of Tashkent and the Uzbeks of Samarkand. The members of this
first cluster were much more heterogeneous than the other two clusters of neighbouring peoples. Conversely the Turkmen cluster had the
lowest variance of any of the clusters in the North Asia region, showing that different Turkmen populations are closely related.
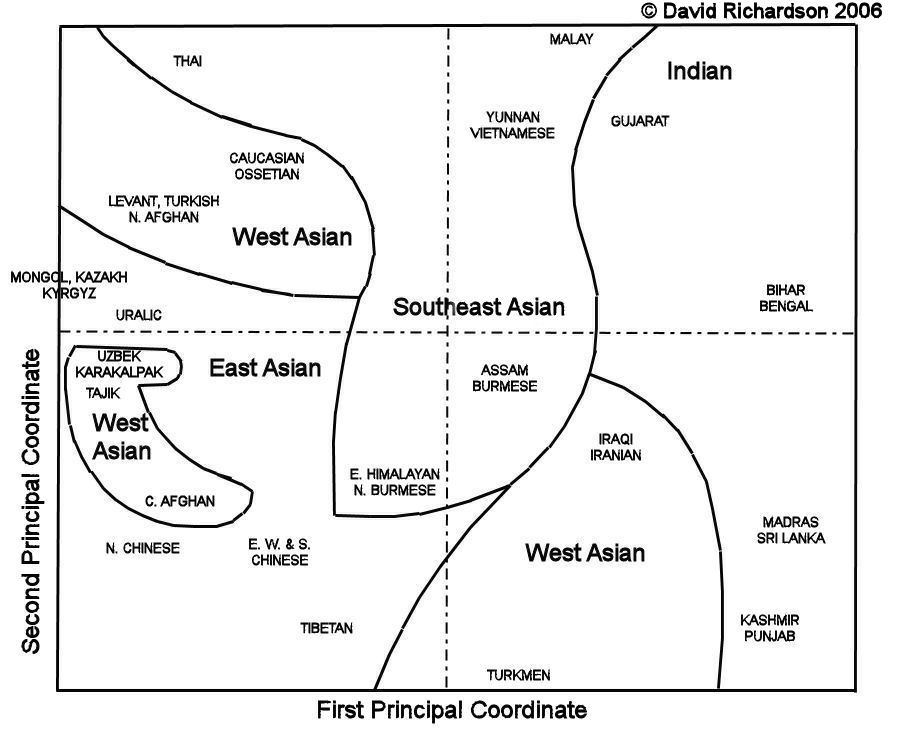
The results of this study were re-presented by Cavalli-Sforza in a more readily understandable graphical form. The coordinates used are
artificial mathematical transformations of the original 9 morphological measurements, designed to identify the distances between different
populations in a simple two-dimensional format. The first two principal coordinates identify a clear division between the Uzbek/Karakalpaks,
and the Turkmen and Iranians, but show similarities between the Uzbek/Karakalpaks and the Tajiks, and also with the western Siberians.
Though not so close there are some similarities between the Uzbek/Karakalpaks and the Qazaqs, Kyrgyz, and Mongols:
Physical Anthropology of Asia redrawn by David Richardson after Bowles 1977
First and Second Principal Coordinates
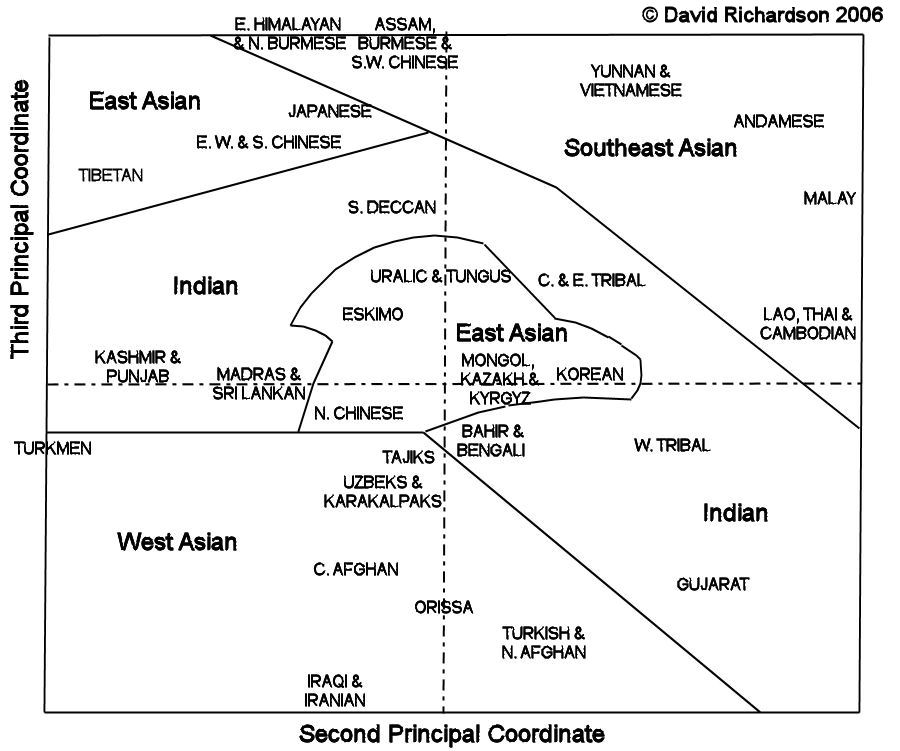
The second and third principal coordinates maintains the similarity between Uzbek/Karakalpaks and Tajiks but emphasizes the more
eastern features of the Qazaqs, Kyrgyz, and Mongols:
Physical Anthropology of Asia redrawn by David Richardson after Bowles 1977
Second and Third Principal Coordinates
The basic average morphology of the Uzbeks and Karakalpaks shows them to be of medium stature, with heads that have an average length but
an above average breadth compared to the other populations of Asia. Their faces are broad and are of maximum height. Their noses
are of average width but have the maximum length found in Asia.
Qazaqs have the same stature but have longer and broader heads. Their faces are shorter but broader, having the maximum breadth found
in Asia, while their noses too are shorter and slightly broader.
Some of these differences in features were noted by some of the early Russian visitors, such as N. N. Karazin, who observed the differences
between the Karakalpaks and the Qazaqs (who at that time were called Kirghiz) when he first entered the northern Aral delta:
"In terms of type, the Karakalpak people themselves differ noticeably from the Kirghizs: flattened Mongolian noses are already a rarity here,
cheek-bones do not stand out so, beards and eyebrows are considerably thicker - there is a noticeably strong predominance of the Turkish race."
The Central Asian Gene Pool
Western researchers tended to under represent Central Asian populations in many of the earlier studies of population genetics.
Cavalli-Sforza, Menozzi, and Piazza, 1994
In 1994 Cavalli-Sforza and two of his colleagues published a landmark study of the worldwide geographic distribution of
human genes. In order to make global comparisons the study was forced to rely upon the most commonly available genetic
markers, and analysed classical polymorphisms based on blood groups, plasma proteins, and red cell enzymes. Sadly no information
was included for Karakalpaks or Qazaqs.
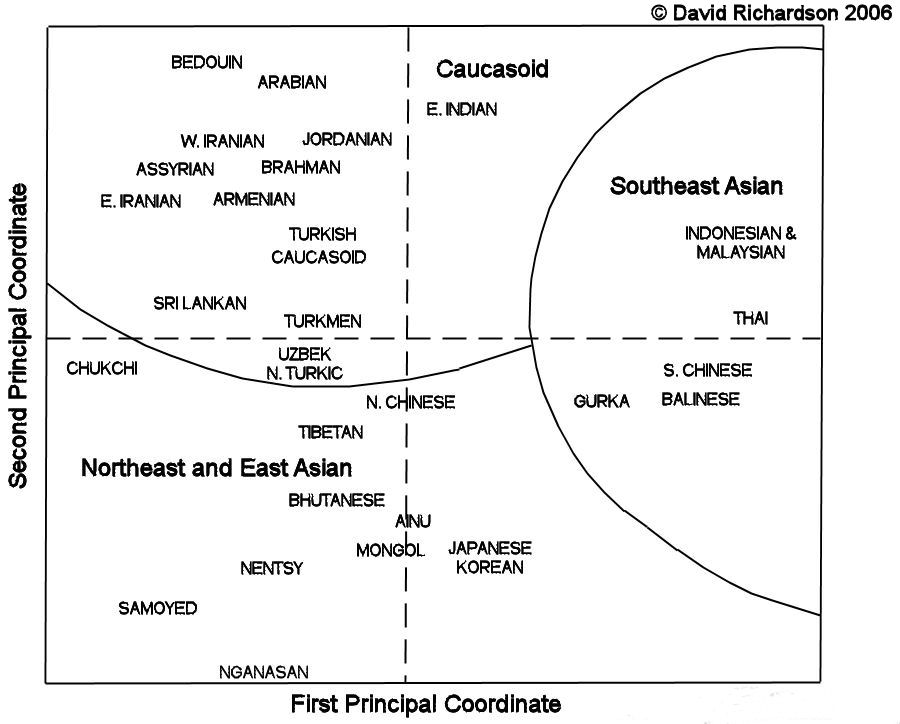
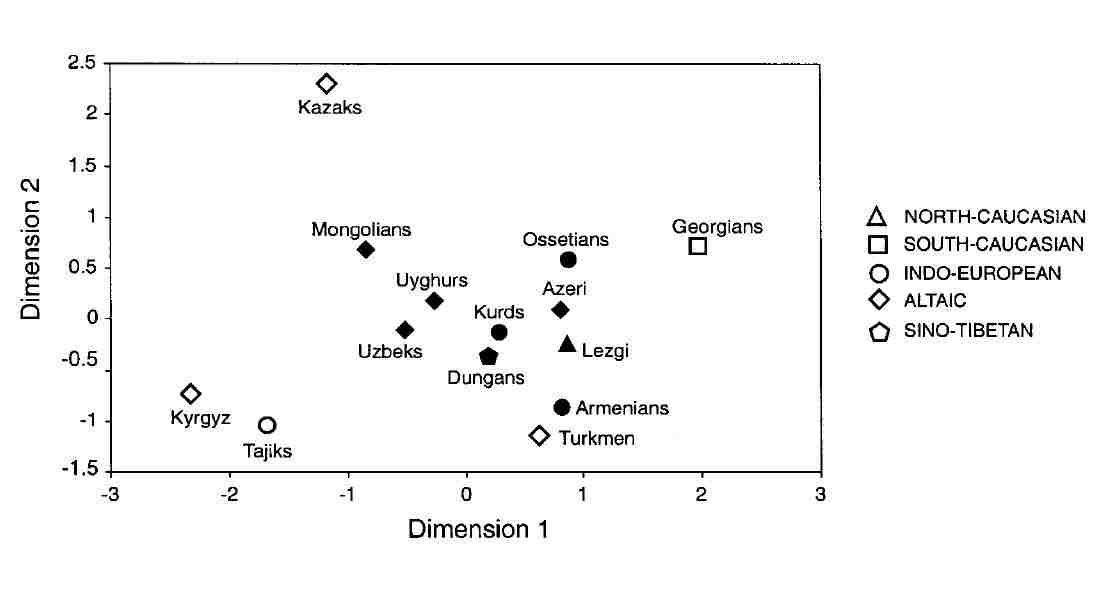
Results were analysed continent by continent. The results for the different populations of Asia grouped the Uzbeks, Turkmen,
and western Turks into a central cluster, located on the borderline between the Caucasian populations of the west and south
and the populations of Northeast Asia and East Asia:
Principal Component Analysis of Asian Populations
Redrawn by David Richardson after Cavelli-Sforza et al, 1994
Comas, Calafell, Pérez-Lezaun et al, 1998
In 1993-94 another Italian team collected DNA samples from four different populations close to the Altai: Qazaq highlanders
living close to Almaty, Uighur lowlanders in the same region, and two Kyrgyz communities - one in the southern highlands,
the other in the northern lowlands of Kyrgyzstan.
The data was used in two studies, both published in 1998. In the first, by Comas et al, mtDNA polymorphisms in these
four communities were compared with other Eurasian populations in the west (Europe, Middle East, and Turkey), centre (the Altai)
and the east (Mongolia, China, and Korea). The four Central Asian populations all showed high levels of sequence diversity -
in some cases the highest in Eurasia. At the same time they were tightly clustered together, almost exactly halfway between
the western and the eastern populations, the exception being that the Mongolians occupied a position close to this central
cluster. The results suggested that the Central Asian gene pool was an admixture of the western and eastern gene pools, formed
after the western and eastern Eurasians had diverged. The authors suggested that this diversity had possibly been enhanced by
human interaction along the Silk Road.
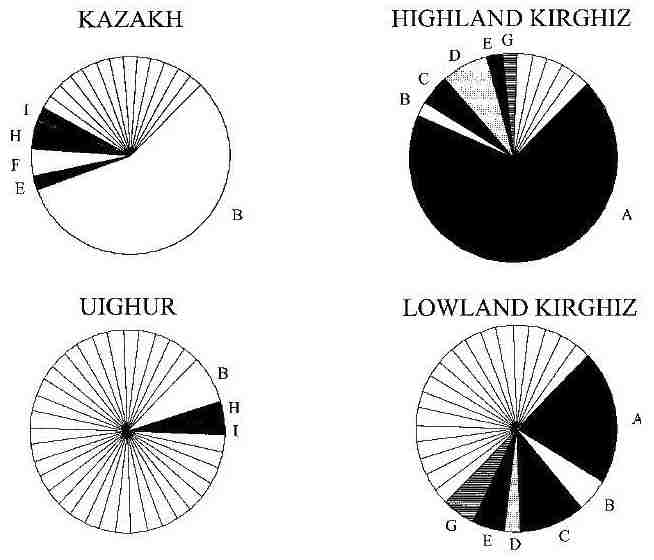
In the second, by Pérez-Lezaun et al, short-tandem-repeat polymorphisms in the Y chromosome were analysed for the
four Central Asian populations alone. Each of the four was found to be highly heterogeneous yet very different from the other
three, the latter finding appearing to contradict the mtDNA results. However the two highland groups had less genetic diversity
because each had very high frequencies for one specific polymorphism:
Y chromosome haplotype frequencies, with labels given to those shared by more than one population
From Pérez-Lezaun et al, 1998.
The researchers resolved the apparent contradiction between the two studies in terms of different migration patterns for men and women.
All four groups practised a combination of exogamy and patrilocal marriage - in other words couples within the same clan could not marry
and brides always moved from their own village to the village of the groom. Consequently the males, and their genes, were isolated and
localized, while the females were mobile and there were more similarities in their genes. The high incidence of a single marker in each
highland community was presumed to be a founder's effect, supported by evidence that the highland Qazaq community had only been
established by lowland Qazaqs a few hundred years ago.
Zerjal, Spencer Wells, Yuldasheva, Ruzibakiev, and Tyler-Smith, 2002
In 2002 a joint Oxford University/Imperial Cancer Research Fund study was published, analysing Y chromosome polymorphisms in 15 different
Central Asian populations, from the Caucasus to Mongolia. It included Uzbeks from the eastern viloyat of Kashkadarya, Qazaqs
and Uighurs from eastern Kazakhstan, Tajiks, and Kyrgyz. Blood samples had been taken from 408 men, living mainly in villages, between 1993
and 1995. In the laboratory the Y chromosomes were initially typed with binary markers to identify 13 haplogroups. Following this,
microsatellite variations were typed in order to define more detailed haplotypes.
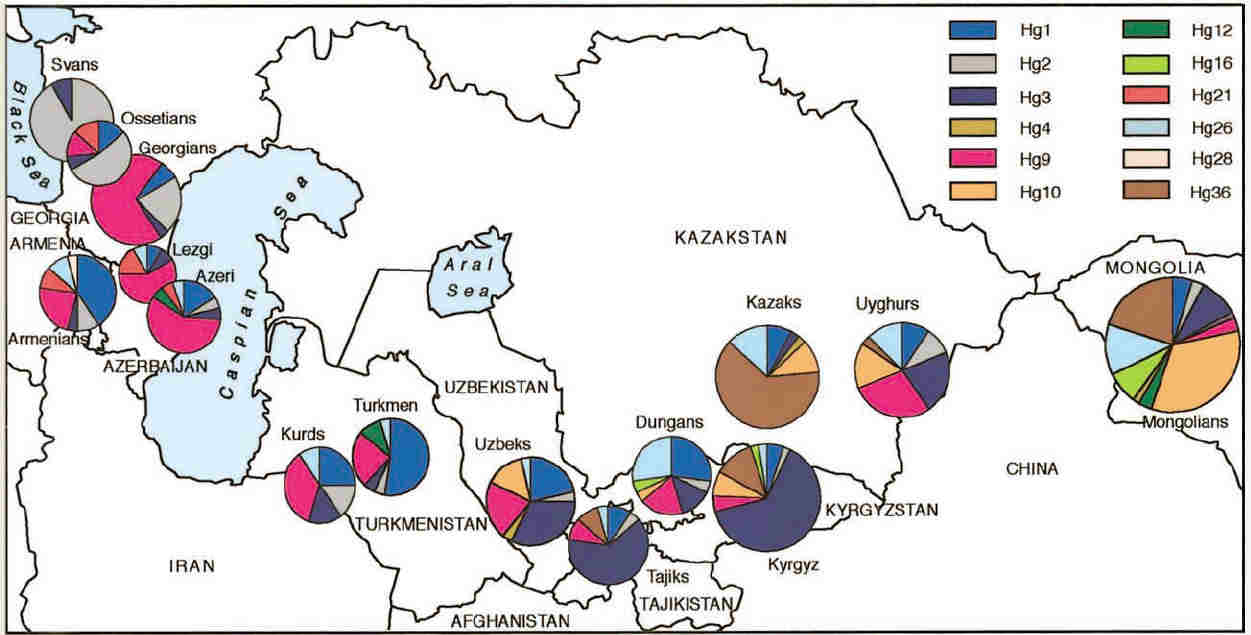
Haplogroup frequencies were calculated for each population and were illustrated by means of the following chart:
Haplogroup frequencies across Central Asia
From Zerjal et al, 2002.
Many of the same haplogroups occurred across the 5,000 km expanse of Central Asia, although with large variations in frequency and with
no obvious overall pattern. Haplogroups 1, 2, 3, 9, and 26 accounted for about 70% of the total sample.
Haplogroups (Hg) 1 and 3 were common in almost all populations, but the highest frequencies of Hg1 were found in Turkmen and Armenians,
while the highest frequencies of Hg3 were found in Kyrgyz and Tajiks. Hg3 was more frequent in the eastern populations, but was only
present at 3% in the Qazaqs. Hg3 is the equivalent of M17, which seems to originate from Russia and the Ukraine, a region not covered
by this survey - see Spencer Wells et al, 2001 below. Hg9 was very frequent in the Middle East and declined in importance across
Central Asia from west to east. However some eastern populations had a higher frequency - the Uzbeks, Uighurs, and Dungans.
Hg10 and its derivative Hg36 showed the opposite pattern, together accounting for 54% of haplogroups for the Mongolians and 73% for
the Qazaqs. Hg26, which is most frequently found in Southeast Asia, occurs with the highest frequencies among the Dungans (26%),
Uighurs (15%), Mongolians (13%), and Qazaqs (13%) in eastern Central Asia. Hg12 and Hg 16 are widespread in Siberia and northern Eurasia
but are rare in Central Asia except for the Turkmen and Mongolians. Hg21 was restricted to the Caucasus region.
The most obvious observation is that virtually each population is quite distinct. As an example, the Uzbeks are quite different from the
Turkmen, Qazaqs, or Mongolians. Only two populations, the Kyrgyz from central Kyrgyzstan and the Tajiks from Pendjikent, show any
similarities.
The researchers measured the genetic diversity of each population using both haplogroup and microsatellite frequencies. Within Central
Asia, the Uzbeks, Uighurs, Dungans, and Mongolians exhibited high genetic diversity, while the Qazaqs, Kyrgyz, Tajiks, and Turkmen
showed low genetic diversity. These differences were explored by examining the haplotype variation within each haplogroup for each
population. Among the Uzbeks, for example, many different haplotypes are widely dispersed across all chromosomes. Among the Qazaqs,
however, the majority of the haplotypes are clustered together and many chromosomes share the same or related haplotypes.
Low diversity coupled with high frequencies of population-specific haplotype clusters are typical of populations that have experienced
a bottleneck or a founder event. The most recent common ancestor of the Tajik population was estimated to date from the early part of
the 1st millennium AD, while the most recent common ancestors of the Qazaq and Kyrgyz populations were placed in the period 1200 to
1500 AD. The authors suggested that bottlenecks might be a feature of societies like the Qazaqs and Kyrgyz with small, widely dispersed
nomadic groups, especially if they had suffered massacres during the Mongol invasion. Of course these calculations have broad confidence
intervals and must be interpreted with caution.
Microsatellite haplotype frequencies were used to investigate the genetic distances among the separate populations. The best
two-dimentional fit produces a picture with no signs of general clustering on the basis of either geography or linguistics:
|
Genetic distances based on micosatellite haplotypes
From Zerjal et al, 2002.
The Kyrgyz (ethnically Turkic) do cluster next to the Tajiks (supposedly of Indo-Iranian origin), but both are well separated from the
neighbouring Qazaqs. The Turkmen, Qazaqs, and Georgians tend to be isolated from the other groups, leaving the Uzbeks in a somewhat
central position, clustered with the Uighurs and Dungans.
The authors attempted to interpret the results of their study in terms of the known history of the region. The apparently underlying
graduation in haplogroup frequencies from west to east was put down to the eastward agricultural expansion out of the Middle East
during the Neolithic, some of the haplogroup markers involved being more recent than the Palaeolithic. Meanwhile Hg3 (equivalent to M17 and
Eu19), which is widespread in Central Asia, was attributed to the migration of the pastoral Indo-Iranian "kurgan culture" eastwards from
the Ukraine in the late 3rd/early 2nd millennium BC. The mountainous Caucasus region seems to have been bypassed by this migration, which
seems to have extended across Central Asia as far as the borders of Siberia and China.
Later events also appear to have left their mark. The presence of a high number of low-frequency haplotypes in Central Asian populations
was associated with the spread of Middle Eastern genes, either through merchants associated with the early Silk Route or the later spread
of Islam. Uighurs and Dungans show a relatively high Middle Eastern admixture, including higher frequencies of Hg9, which might indicate
their ancestors migrated from the Middle East to China before moving into Central Asia.
High frequencies of Hg10 and its derivative Hg36 are found in the majority of Altaic-speaking populations, especially the Qazaqs, but
also the Uzbeks and Kyrgyz. Yet its contribution west of Uzbekistan is low or undetectable. This feature is associated with the
progressive migrations of nomadic groups from the east, from the Hsiung-Nu, to the Huns, the Turks, and the Mongols. Of course Central
Asians have not only absorbed immigrants from elsewhere but have undergone expansions, colonizations and migrations of their own,
contributing their DNA to surrounding populations. Hg1, the equivalent of M45 and its derivative markers, is believed to have originated
in Central Asia and is found throughout the Caucasus and in Mongolia.
The Karakalpak Gene Pool
Spencer Wells et al, 2001
The first examination of Karakalpak DNA appeared as part of a widespread study of Eurasian Y chromosome diversity published by
Spencer Wells et al in 2001. It included samples from 49 different Eurasian groups, ranging from western Europe, Russia,
the Middle East, the Caucasus, Central Asia, South India, Siberia, and East Asia. Data on 12 other groups was taken from the literature.
In addition to the Karakalpaks, the Central Asian category included seven separate Uzbek populations selected from Ferghana to Khorezm,
along with Turkmen from Ashgabat, Tajiks from Samarkand, and Qazaqs and Uighurs from Almaty. The study used biallelic markers that were
then assigned to 23 different haplotypes. To illustrate the results the latter were condensed into 7 evolutionary-related groups.
The study found that the Uzbek, Karakalpak, and Tajik populations had the highest haplotype diversity in Eurasia, the Karakalpaks having
the third highest diversity of all 49 groups. The Qazaqs and Kyrgyz had a significantly lower diversity.
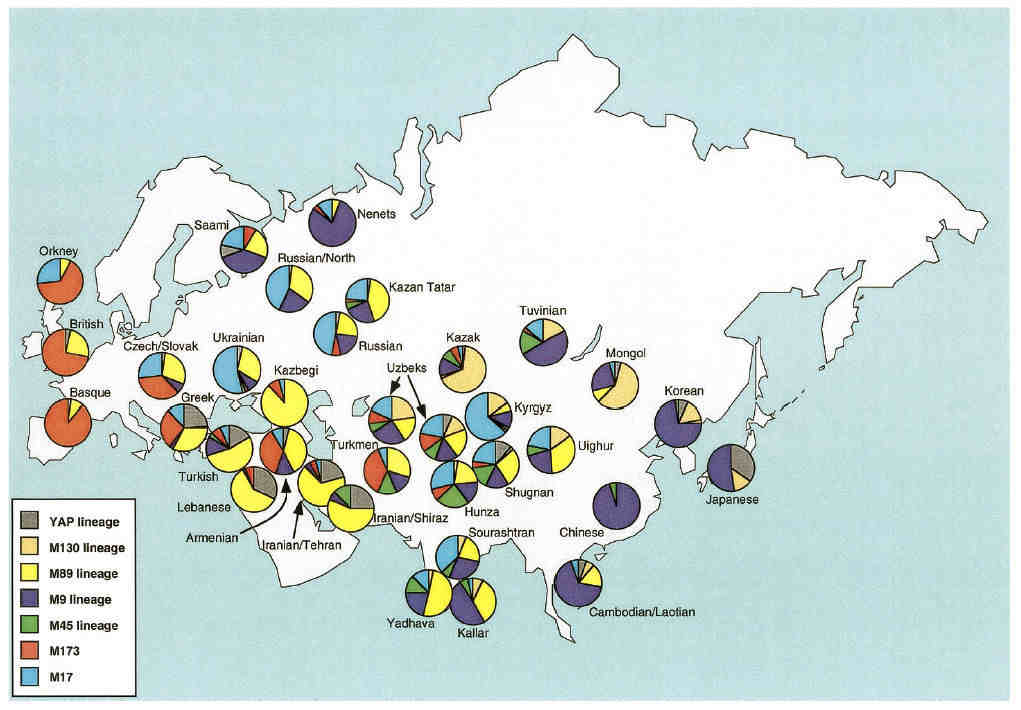
This diversity is obvious from the chart comparing haplotype frequencies across Eurasia:
Distribution of Y chromosome haplotype lineages across various Eurasian populations
From Spencer Wells et al, 2001.
Uzbeks have a fairly balanced haplotype profile, while populations in the extreme west and east are dominated by one specific haplotype
lineage - the M173 lineage in the extreme west and the M9 lineage in the extreme east and Siberia.
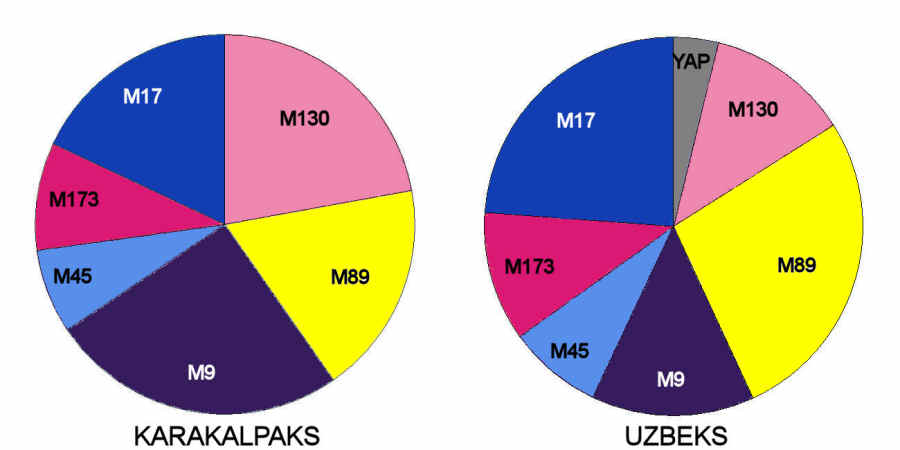
The Karakalpaks are remarkably similar to the Uzbeks:
Distribution of Y chromosome haplotype lineages in Uzbeks and Karakalpaks
From Spencer Wells et al, 2001.
the main differences being that Karakalpaks have a higher frequency of M9 and M130 and a lower frequency of M17 and M89 haplotype
lineages. M9 is strongly linked to Chinese and other far-eastern peoples, while M130 is associated with Mongolians and Qazaqs.
On the other hand, M17 is strong in Russia, the Ukraine, the Czech and Slovak Republics as well as in Kyrgyz populations, while M89
has a higher frequency in the west. It seems that compared to Uzbeks, the Karakalpak gene pool has a somewhat higher frequency of
haplotypes that are associated with eastern as opposed to western Eurasian populations.
In fact the differences between Karakalpaks and Uzbeks are no more pronounced than between the Uzbeks themselves. Haplotype frequencies
for the Karakalpaks tend to be within the ranges measured across the different Uzbek populations:
Comparison of Karakalpak haplotype lineage frequencies to other ethnic groups in Central Asia
| Population | Sample
Size | YAP |
M130 | M89 | M9 |
M45 | M173 | M17 |
Total |
| Karakalpaks | 44 |
- | 22 | 18 | 25 | 7 |
9 | 18 | 99 |
| Uzbeks Average | 366 |
4 | 12 | 27 | 14 | 8 |
11 | 24 | 100 |
| Uzbeks Range | 366 |
0 - 7 | 7-18 | 19-34 | 5-21 | 4-11 |
6-21 | 13-30 | 100 |
| Uzbeks Khorezm | 70 |
7 | 10 | 19 | 13 | 10 |
9 | 30 | 98 |
| Uzbeks Bukhara | 58 |
2 | 9 | 34 | 19 | 4 |
7 | 28 | 103 |
| Uzbeks Samarkand | 45 |
2 | 18 | 31 | 15 | 9 |
11 | 13 | 99 |
| Uzbeks Kashkadarya | 19 |
- | 16 | 33 | 5 | 11 |
21 | 16 | 102 |
| Uzbeks Surkhandarya | 68 |
6 | 12 | 19 | 21 | 5 |
6 | 29 | 98 |
| Uzbeks Tashkent | 43 |
5 | 7 | 30 | 12 | 7 |
12 | 28 | 101 |
| Uzbeks Ferghana | 63 |
6 | 13 | 22 | 16 | 10 |
13 | 22 | 102 |
| |
| Turkmen Ashgabat | 30 |
0 | - | 30 | 13 | 13 |
37 | 7 | 100 |
| Qazaqs | 54 |
2 | 66 | 2 | 13 | 8 |
6 | 4 | 101 |
| Uighurs | 41 |
- | 15 | 34 | 21 | 7 |
0 | 22 | 99 |
| Kyrgyz | 52 |
- | 14 | 6 | 12 | 2 |
2 | 63 | 99 |
| Tajiks Samarkand | 40 |
10 | 8 | 23 | 18 | 8 |
10 | 25 | 102 |
| Tatars Crimea | 22 |
5 | 9 | 37 | 10 | 0 |
9 | 32 | 102 |
| Tatars Kazan | 38 |
3 | 0 | 42 | 24 | 5 |
3 | 24 | 101 |
| Iranians Tehran | 24 |
21 | 0 | 67 | 4 | 0 |
4 | 4 | 100 |
| Siberians Tuva | 42 |
0 | 17 | 0 | 49 | 17 |
2 | 14 | 99 |
| Mongolian | 24 |
4 | 59 | 6 | 25 | 0 |
0 | 4 | 98 |
Statistically Karakalpaks are genetically closest to the Uzbeks from Ferghana, followed by those from Surkhandarya, Samarkand, and
finally Khorezm. They are furthest from the Uzbeks of Bukhara, Tashkent, and Kashkadarya.
These results also show the distance between the Karakalpaks and the other peoples of Central Asia and its neighbouring regions.
Next to the Uzbeks, the Karakalpaks are genetically closest to the Tatars and Uighurs. However they are quite distant from the Turkmen,
Qazaqs, Kyrgyz, Siberians, and Iranians.
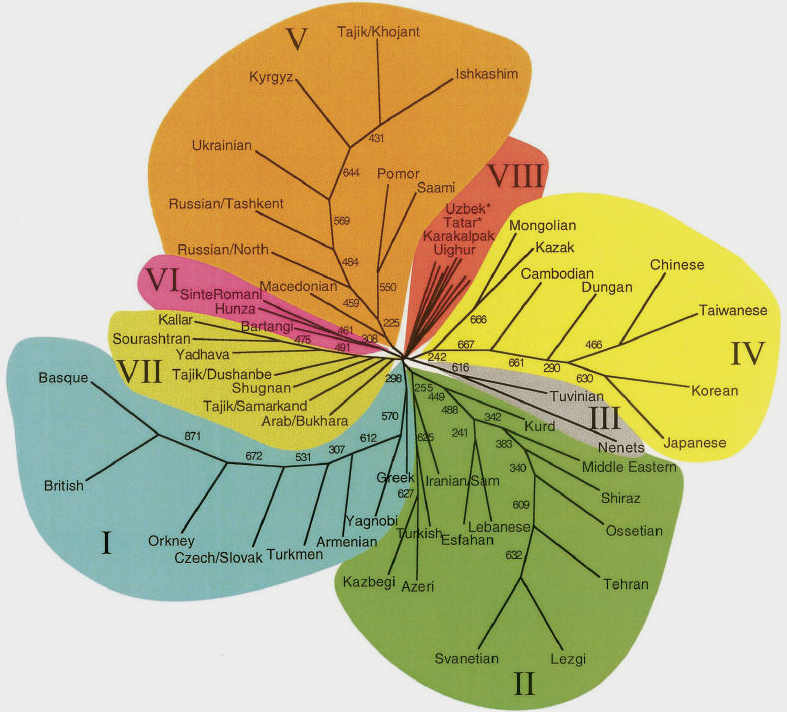
The researchers produced a "neighbour-joining" tree, which clustered the studied populations into eight categories according to the
genetic distances between them. The Karakalpaks were classified into cluster VIII along with Uzbeks, Tatars, and Uighurs - the
populations with the highest genetic diversity. They appear sandwiched between the peoples of Russian and the Ukraine and the
Mongolians and Qazaqs.
Neighbour-joining tree of 61 Eurasian Populations
Karakalpaks are included in cluster VIII along with Uzbeks, Tatars, and Uighurs
From Spencer Wells et al, 2001.
Spencer Wells and his colleagues did not attempt to explain why the Karakalpak gene pool is similar to Uzbek but is different from the
Qazaq, a surprising finding given that the Karakalpaks lived in the same region as the Qazaqs of the Lesser Horde before migrating
into Khorezm. Instead they suggested that the high diversity in Central Asia might indicate that its population is among the oldest
in Eurasia. M45 is the ancestor of haplotypes M173, the predominant group found in Western Europe, and is thought to have arisen in
Central Asia about 40,000 years ago. M173 occurred about 30,000 years old, just as modern humans began their migration from Central
Asia into Europe during the Upper Palaeolithic. M17 (also known as the Eu19 lineage) has its origins in eastern Europe and the Ukraine
and may have been initially introduced into Central Asia following the last Ice Age and re-introduced later by the south-eastern migration
of the Indo-Iranian "kurgan" culture.
Comas et al, 2004
At the beginning of 2004 a complementary study was published by David Comas, based on the analysis of mtDNA haplogroups from 12 Central
Asian and neighbouring populations, including Karakalpaks, Uzbeks, and Qazaqs. Sample size was only 20, dropping to 16 for Dungans and
Uighurs, so that errors in the results for individual populations could be high.
The study reconfirmed the high genetic diversity within Central Asian populations. However a high proportion of sequences originated elsewhere,
suggesting that the region had experienced "intense gene flow" in the past.
The haplogroups were divided into three types according to their origins: West Eurasian, East Asian, and India. Populations showed a
graduation from the west to the east with the Karakalpaks occupying the middle ground, with half of their haplogroups having a western
origin and the other half having an eastern origin. Uzbek populations contained a small Indian component.
Mixture of western and eastern mtDNA haplogroups across Central Asia
| Population | West Eurasian | East Asian |
Indian |
Total |
| Crimean Tatars | 100 | 0 | 0 | 100 |
| Iranians | 85 | 15 | 0 | 100 |
| Turkmen | 55 | 45 | 0 | 100 |
| Karakalpaks | 50 | 50 | 0 | 100 |
| Khorezmian Uzbeks | 54 | 28 | 17 | 100 |
| Bukharan Arabs | 70 | 30 | 0 | 100 |
| Uzbeks | 45 | 44 | 9 | 100 |
| Tajiks | 55 | 45 | 0 | 100 |
| Qazaqs | 45 | 44 | 9 | 100 |
| Kyrgyz | 17 | 74 | 9 | 100 |
| Dungans | 31 | 69 | 0 | 100 |
| Uighurs | 6 | 94 | 0 | 100 |
The researchers found that two of the haplogroups of East Asian origin (D4c and G2a) not only occurred at higher frequencies
in Central Asia than in neighbouring populations but appeared in many related but diverse forms. These may have originated as
founder mutations some 25,000 to 30,000 years ago, expanded as a result of genetic drift and subsequently become dispersed into
the neighbouring populations. Their incidence was highest in the Qazaqs, and second highest in the Turkmen and Karakalpaks.
The majority of the other lineages separate into two types with either a western or an eastern origin. They do not overlap,
suggesting that they were already differentiated before they came together in Central Asia. Furthermore the eastern group contains
both south-eastern and north-eastern components. One explanation for their admixture in Central Asia is that the region was originally
inhabited by Western people, who were then partially replaced by the arrival of Eastern people. There is genetic evidence from
archaeological sites in eastern China of a drastic shift, between 2,500 and 2,000 years ago, from a European-like population to
the present-day East Asian population.
The presence of ancient Central Asian sequences suggests it is more likely that the people of Central Asia are a mixture of two
differentiated groups of peoples who originated in west and east Eurasia respectively.
Chaix and Heyer et al, 2004
The most interesting study of Karakalpak DNA so far was published by a team of French workers in the autumn of 2004. It was based on
blood samples taken during two separate expeditions to Karakalpakstan in 2001 and 2002, organized with the assistance of IFEAC, the
Institut Français d'Etudes sur l'Asie Centrale, based in Tashkent. The samples consisted of males belonging to five different ethnic
groups: Qon'ırat Karakalpaks (sample size 53), On To'rt Urıw Karakalpaks (53), Qazaqs (50), Khorezmian Uzbeks (40), and Turkmen (51).
The study was based on the analysis of Y chromosome haplotypes from DNA extracted from white blood cells. In addition to providing
samples for DNA analysis, participants were also interviewed to gather information on their paternal lineages and tribal and clan
affiliations.
Unfortunately the published results only focused on the genetic relationships between the tribes, clans and lineages of these five
ethnic groups. However before reviewing these important findings it is worth looking at the more general aspects that emerged from
the five samples. These were summarized by Professor Evelyne Heyer and Dr R Chaix at a workshop on languages and genes held in France
in 2005, where the results from Karakalpakstan were compared with the results from similar expeditions to Kyrgyzstan, the Bukhara,
Samarkand, and Ferghana Valley regions of Uzbekistan, and Tajikistan as well as with some results published by other research teams.
In some cases comparisons were limited by the fact that the genetic analysis of samples from different regions was not always done
according to the same protocols.
The first outcome was the reconfirmation of the high genetic diversity among Karakalpaks and Uzbeks:
Y Chromosome Diversity across Central Asia
| Population | Region | Sample Size | Diversity |
| Karakalpak Qon'ırat | Karakalpakstan | 54 | 0.97 |
| Karakalpak On To'rt Urıw | Karakalpakstan | 54 | 0.89 |
| Uzbek Khorezm | Karakalpakstan | 54 | 0.97 |
| Qazaq Khorezm | Karakalpakstan | 49 | 0.84 |
| Turkmen Khorezm | Karakalpakstan | 51 | 0.84 |
| Uzbek Kashkadarya | Uzbekistan | 28 | 1.00 |
| Uighur Almaty | Kazakhstan | 33 | 0.98 |
| Qazaq Almaty | Kazakhstan | 14 | 0.86 |
| Turkmen Ashgabat | Turkmenistan | 21 | 0.94 |
| Tajik Pendjikent | Tajikistan | 22 | 0.87 |
| Tajik Kamangaron | Ferghana Valley | 30 | 0.98 |
| Tajik Richtan | Ferghana Valley | 29 | 0.98 |
| Kyrgyz Central | Kyrgyzstan | 37 | 0.91 |
| Kyrgyz Andijan | Uzbek Ferghana Valley | 46 | 0.82 |
| Kyrgyz Jankatalab | Uzbek Ferghana Valley | 20 | 0.78 |
| Kyrgyz Doboloo | Uzbek Ferghana Valley | 22 | 0.70 |
The high diversities found in Uighur and Tajik communities also agreed with earlier findings. Qon'ırat Karakalpaks had somewhat
greater genetic diversity than On To'rt Urıw Karakalpaks. Some of these figures are extremely high. A diversity of zero implies
a population where every individual is identical. A diversity of one implies the opposite, the haplotypes of every individual
being different.
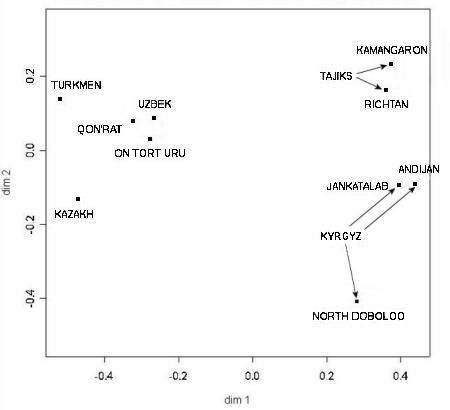
The second more important finding concerned the Y chromosome genetic distances among different Central Asian populations. As
usual this was presented in two dimensions:
Genetic distances between ethnic populations in Karakalpakstan and the Ferghana Valley
From Chaix and Heyer et al, 2004.
The researchers concluded that Y chromosome genetic distances were strongly correlated to geographic distances. Not only are Qon'ırat
and On To'rt Urıw populations genetically close, both are also close to the neighbouring Khorezmian Uzbeks. Together they give the
appearance of a single population that has only relatively recently fragmented into three separate groups. Clearly this situation is
mirrored with the two Tajik populations living in the Ferghana Valley and also with two of the three Kyrgyz populations from the same
region. Although close to the local Uzbeks, the two Karakalpak populations have a slight bias towards the local Qazaqs.
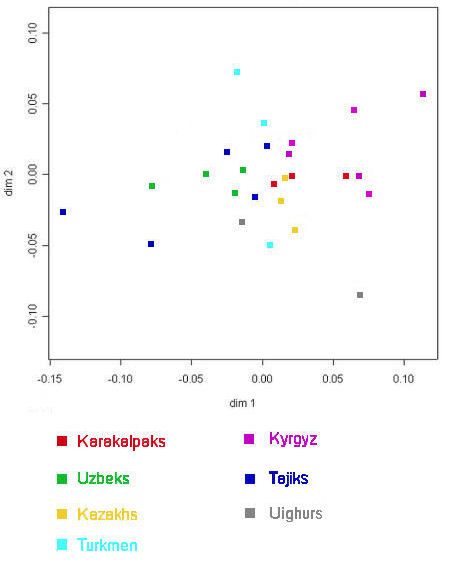
The study of the Y chromosome was repeated for the mitichondrial DNA, to provide a similar picture for the female half of the same
populations. The results were compared to other studies conducted on other groups of Central Asians. We have redrawn the chart showing
genetic distances among populations, categorizing different ethnic groups by colour to facilitate comparisons:
|
Genetic distances among ethnic populations in Central Asia
Based on mitochondrial DNA polymorphisms
From Heyer, 2005.
The French team concluded that, in this case, genetic distances were not related to either geographical distances or to linguistics.
However this is not entirely true because there is some general clustering among populations of the same ethnic group, although by
no means as strong as that observed from the Y chromosome data. The three Karakalpak populations highlighted in red consist of the
On To'rt Urıw (far right), the Qon'ırat (centre), and the Karakalpak sample used in the Comas 2004 study (left). The Uzbeks are shown in green
and those from Karakalpakstan are the second from the extreme left, the latter being the Uzbeks from Samarkand. A nearby group of
Uzbeks from Urgench in Khorezm viloyati appear extreme left. There is some relationship between the mtDNA of the Karakalpak
and Uzbek populations of the Aral delta therefore, but it is much weaker than the relationship between their Y chromosome DNA. On the
other hand the Qazaqs of Karakalpakstan, the uppermost yellow square, are very closely related to the Karakalpak Qon'ırat according to
their mtDNA.
These results are similar to those that emerged from the Italian studies of Qazaq, Uighur, and Kyrgyz Y chromosome and mitochondrial
DNA. Ethnic Turkic populations are generally exogamous. Consequently the male DNA is relatively isolated and immobile because men
traditionally stay in the same village from birth until death. They had to select their wives from other geographic regions
and sometimes married women from other ethnic groups. The female DNA within these groups is consequently more diversified. The results
suggest that in the delta, some Qon'ırat men have married Qazaq women and/or some Qazaq men have married Qon'ırat women.
Let us now turn to the primary focus of the Chaix and Heyer paper. Are the tribes and clans of the Karakalpaks and other ethnic groups
living within the Aral delta linked by kinship? Y chromosome polymorphisms were analysed for each separate lineage, clan, tribe, and
ethnic group using single tandem repeats. The resulting haplotypes were used to calculate a kinship coefficient at each respective
level.
Within the two Karakalpak samples the Qon'ırat were all Shu'llik and came from several clans, only three of which permitted the computation
of kinship: the Qoldawlı, Qıyat, and Ashamaylı clans. However none of these clans had recognized lineages. The Khorezmian Uzbeks have also
long ago abandoned their tradition of preserving genealogical lineages.
The On To'rt Urıw were composed of four tribes, four clans, and four lineages:
- Qıtay tribe
- Qıpshaq tribe, Basar clan
- Keneges tribe, Omır and No'kis clans
- Man'g'ıt tribe, Qarasıraq clan
The Qazaq and the Turkmen groups were also structured along tribal, clan, and lineage lines.
The results of the study showed that lineages, where they were still maintained, exhibited high levels of kinship, the On To'rt Urıw having
by far the highest. People belonging to the same lineage were therefore significantly more related to each other than people selected at
random in the overall global population. Put another way, they share a common ancestor who is far more recent than the common ancestor for
the population as a whole:
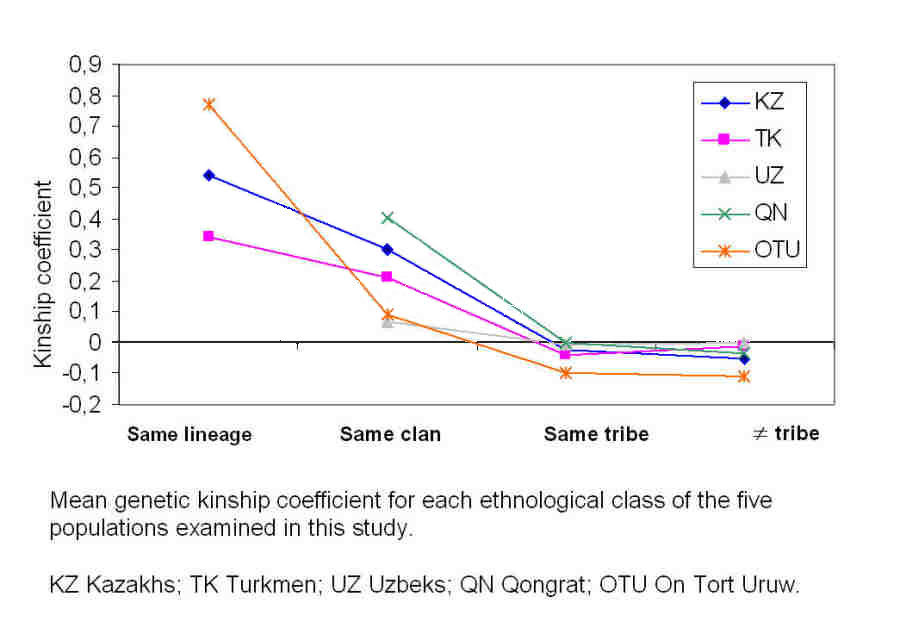
|
Kinship coefficients for five different ethnic populations, including the Qon'ırat and the On To'rt Urıw.
From Chaix and Heyer et al, 2004.
The kinship coefficients at the clan level were lower, but were still significant in three groups - the Karakalpak Qon'ırat, the Qazaqs,
and the Turkmen. However for the Karakalpak On To'rt Urıw and the Uzbeks, men from the same clan were only fractionally more related to
each other than were men selected randomly from the population at large. When we reach the tribal level we find that the men in all five
ethnic groups show no genetic kinship whatsoever.
In these societies the male members of some but not all tribal clans are partially related to varying degrees, in the sense that they are
the descendants of a common male ancestor. Depending on the clan concerned this kinship can be strong, weak, or non-existant. However the
members of different clans within the same tribe show no such interrelationship at all. In other words, tribes are conglomerations of
clans that have no genetic links with each other apart from those occurring between randomly chosen populations. It suggests that such tribes
were formed politically, as confederations of unrelated clans, and not organically as a result of the expansion and sub-division of an
initially genetically homogenous extended family group.
By assuming a constant rate of genetic mutation over time and a generation time of 30 years, the researchers were able to calculate the
number of generations (and therefore years) that have elapsed since the existence of the single common ancestor. This was essentially the
minimum age of the descent group and was computed for each lineage and clan. However the estimated ages computed were very high. For example,
the age of the Qon'ırat clans was estimated at about 460 generations or 14,000 years (late Ice Age), while the age of the On To'rt Urıw lineages
was estimated at around 200 generations or 6,000 years (early Neolithic). Clearly these results are ridiculous. The explanation is that each
group included immigrants or outsiders who were clearly unrelated to the core population.
The calculation was therefore modified, restricting the sample to those individuals who belonged to the modal haplogroup of the descent group.
This excluded about 17% of the men in the initial sample. Results were excluded for those descent groups that contained less than three
individuals:
| Descent Group | Population | Number of
Descent Groups |
Number of
Generations | Age in years | 95% Confidence
Interval |
| Clan | Karakalpak
Qon'ırat | 2 |
35 | 1,058 | 454 - 3,704 |
| Clan | Qazaq | 1 |
20 | 595 | 255 - 2,083 |
| Clan | Turkmen | 4 | 102 |
3,051 | 1,307 - 10,677 |
| Lineage | Karakalpak
On To'rt Urıw | 4 |
13 | 397 | 170 - 1,389 |
| Lineage | Qazaq | 2 | 14 |
415 | 178 - 1,451 |
| Lineage | Turkmen | 3 | 17 |
516 | 221 - 1,806 |
The age of the On To'rt Urıw and other lineages averaged about 15 generations, equivalent to about 400 to 500 years. The age of the clans
varied more widely, from 20 generations for the Qazaqs, to 35 generations for the Qon'ırat, and to 102 generations for the Turkmen.
This dates the oldest common ancestor of the Qazaq and Qon'ırat clans to a time some 600 to 1,200 years ago. However the common
ancestor of the Turkmen clans is some 3,000 years old. The high ages of the Turkmen clans was the result of the occurrence of a
significantly mutated haplotype within the modal haplogroup. It was difficult to judge whether these individuals were genuinely related
to the other clan members or were themselves recent immigrants.
These figures must be interpreted with considerable caution. Clearly the age of a clan's common ancestor is not the same as the age of the
clan itself, since that ancestor may have had ancestors of his own, whose lines of descent have become extinct over time. The calculated
ages therefore give us a minimum limit for the age of the clan and not the age of the clan itself.
In reality however, the uncertainty in the assumed rate of genetic mutation gives rise to extremely wide 95% confidence intervals. The
knowledge that certain Karakalpak Qon'ırat clans are most likely older than a time ranging from 450 to 3,700 years is of little practical
use to us. Clearly more accurate models are required.
Chaix, R.; Quintana-Murci, L.; Hegay, T.; Hammer, M. F.; Mobasher, Z.; Austerlitz, F.; and Heyer, E., 2007
The latest analysis of Karakalpak DNA comes from a study examining the genetic differences between various pastoral and farming populations
in Central Asia. In this region these two fundamentally different economies are organized according to quite separate social traditions:
- pastoral populations are classified into what their members claim to be descent groups (tribes, clans, and lineages), practice exogamous
marriage (where men must marry women from clans that are different to their own), and are organized on a patrilineal basis (children being
affiliated to the descent group of the father, not the mother).
- farmer populations are organized into nuclear and extended families rather than tribes and often practise endogamous marriage (where men
marry women from within the same clan, often their cousins).
The study aims to identify differences in the genetic diversity of the two groups as a result of these two different lifestyles. It examines
the genetic diversity of:
- maternally inherited mitochondrial DNA in 12 pastoral and 9 farmer populations, and
- paternally inherited Y-chromosomes in 11 pastoral and 7 farmer populations.
The diversity of mtDNA was examined by investigating one of two short segments, known as hypervariable segment number 1 or HVS-1. This and HVS-2
have been found to contain the highest density of neutral polymorphic variations between individuals.
The diversity of the Y chromosome was examined by investigating 6 short tandem repeats (STRs) in the non-recombining region of the chromosome.
This particular study sampled mtDNA from 5 different populations from Karakalpakstan: On To'rt Urıw Karakalpaks, Qon'ırat Karakalpaks,
Qazaqs, Turkmen, and Uzbeks. Samples collected as part of other earlier studies were used to provide mtDNA data on 16 further populations
(one of which was a general group of Karakalpaks) and Y chromosome data on 20 populations (two of which were On To'rt Urıw and Qon'ırat
Karakalpaks sampled in 2001 and 2002). The sample size for each population ranged from 16 to 65 individuals.
Both Karakalpak arıs were classified as pastoral, along with Qazaqs, Kyrgyz, and Turkmen. Uzbeks were classified as farmers, along with
Tajiks, Uighurs, Kurds, and Dungans.
Results of the mtDNA Analysis
The results of the mtDNA analysis are given in Table 1, copied from the paper.
Table 1. Sample Descriptions and Estimators of Genetic Diversity from the mtDNA Sequence
| Population | n | Location |
Long | Lat | H | π |
D | pD | Ps |
C |
| Karakalpaks | 20 | Uzbekistan | 58 |
43 | 0.99 | 5.29 | -1.95 | 0.01 |
0.90 | 1.05 |
| Karakalpaks (On To'rt Urıw) | 53 | Uzbekistan/Turkmenistan border |
60 | 42 | 0.99 | 5.98 | -1.92 |
0.01 | 0.70 | 1.20 |
| Karakalpaks (Qon'ırat) | 55 | Karakalpakstan |
59 | 43 | 0.99 | 5.37 | -2.01 |
0.01 | 0.82 | 1.15 |
| Qazaqs | 50 | Karakalpakstan |
63 | 44 | 0.99 | 5.23 | -1.97 |
0.01 | 0.88 | 1.11 |
| Qazaqs | 55 | Kazakhstan |
80 | 45 | 0.99 | 5.66 | -1.87 |
0.01 | 0.69 | 1.25 |
| Qazaqs | 20 | |
68 | 42 | 1.00 | 5.17 | -1.52 |
0.05 | 1.00 | 1.00 |
| Kyrgyz | 20 | Kyrgyzstan |
74 | 41 | 0.97 | 5.29 | -1.38 |
0.06 | 0.55 | 1.33 |
| Kyrgyz (Sary-Tash) | 47 | South Kyrgyzstan, Pamirs |
73 | 40 | 0.97 | 5.24 | -1.95 |
0.01 | 0.49 | 1.52 |
| Kyrgyz (Talas) | 48 | North Kyrgyzstan |
72 | 42 | 0.99 | 5.77 | -1.65 |
0.02 | 0.77 | 1.14 |
| Turkmen | 51 | Uzbekistan/Turkmenistan border |
59 | 42 | 0.98 | 5.48 | -1.59 |
0.04 | 0.53 | 1.42 |
| Turkmen | 41 | Turkmenistan |
60 | 39 | 0.99 | 5.20 | -2.07 |
0.00 | 0.73 | 1.21 |
| Turkmen | 20 | |
59 | 40 | 0.98 | 5.28 | -1.71 |
0.02 | 0.75 | 1.18 |
| Dungans | 16 | Kyrgyzstan |
78 | 41 | 0.94 | 5.27 | -1.23 |
0.12 | 0.31 | 1.60 |
| Kurds | 32 | Turkmenistan |
59 | 39 | 0.97 | 5.61 | -1.35 |
0.05 | 0.41 | 1.52 |
| Uighurs | 55 | Kazakhstan |
82 | 47 | 0.99 | 5.11 | -1.91 |
0.01 | 0.62 | 1.28 |
| Uighurs | 16 | Kyrgyzstan |
79 | 42 | 0.98 | 4.67 | -1.06 |
0.15 | 0.63 | 1.23 |
| Uzbeks (North) | 40 | Karakalpakstan |
60 | 43 | 0.99 | 5.49 | -2.03 |
0.00 | 0.68 | 1.21 |
| Uzbeks (South) | 42 | Surkhandarya, Uzbekistan |
67 | 38 | 0.99 | 5.07 | -1.96 |
0.01 | 0.81 | 1.14 |
| Uzbeks (South) | 20 | Uzbekistan |
66 | 40 | 0.99 | 5.33 | -1.82 |
0.02 | 0.90 | 1.05 |
| Uzbeks (Khorezm) | 20 | Khorezm, Uzbekistan |
61 | 42 | 0.98 | 5.32 | -1.62 |
0.04 | 0.70 | 1.18 |
| Tajiks (Yagnobi) | 20 | |
71 | 39 | 0.99 | 5.98 | -1.76 |
0.02 | 0.90 | 1.05 |
Key: the pastoral populations are in the grey area; the farmer populations are in the white area.
The table includes the following parameters:
- sample size, n, the number of individuals sampled in each population. Individuals had to be unrelated to any other member of the same sample
for at least two generations.
- the geographical longitude and latitude of the population sampled.
- heterozygosity, H, the proportion of different alleles occupying the same position in each mtDNA sequence. It measures the frequency of
heterozygotes for a particular locus in the genetic sequence and is one of several statistics indicating the level of genetic variation or
polymorphism within a population. When H=0, all alleles are the same and when H=1, all alleles are different.
- the mean number of pairwise differences, π, measures the average number of nucleotide differences between all pairs of HVS-1 sequences.
This is another statistic indicating the level of genetic variation within a population, in this case measuring the level of mismatch
between nucleotides.
- Tajima�s D, D, measures the frequency distribution of alleles in a nucleotide sequence and is based on the difference between two estimations
of the population mutation rate. It is often used to distinguish between a DNA sequence that has evolved randomly (D=0) and one that has experienced directional selection favouring a single allele. It is consequently used as a test for natural selection. However it is also influenced by population history and negative values of D can indicate high rates of population growth.
- the probability that D is significantly different from zero, pD.
- the proportion of singletons, Ps, measures the relative number of unique polymorphisms in the sample. The higher the proportion of singletons,
the greater the population has been affected by inward migration.
- the mean number of individuals carrying the same mtDNA sequence, C, is an inverse measure of diversity. The more individuals with the same
sequence, the less diversity within the population and the higher proportion of individuals who are closely related.
The table shows surprisingly little differentiation between pastoral and farmer populations. Both show high levels of within population
genetic diversity (for both groups, median H=0.99 and π is around 5.3). Further calculations of genetic distance between populations, Fst, (
not presented in the table but given graphically in the online reference below) showed a corresponding low level of genetic differentiation
among pastoral populations as well as among farmer populations.
Both groups of populations also showed a significantly negative Tajima�s D, which the authors attribute to a high rate of demographic growth in
neutrally evolving populations.
Supplementary data made available online showed a weak correlation between genetic distance, Fst, and geographic distance for both pastoral and
farmer populations. Click here for redirection to the relevant
online site.
Results of the Y chromosome Analysis
The results of the Y chromosome analysis are given in Table 2, also copied from the paper:
Table 1. Sample Descriptions and Estimators of Genetic Diversity from the Y chromosome STRs
| Population | n | Location |
Long | Lat | H | π |
r | Ps | C |
| Karakalpaks (On To'rt Urıw) | 54 | Uzbekistan/Turkmenistan border |
60 | 42 | 0.86 | 3.40 | 1.002 |
0.24 | 2.84 |
| Karakalpaks (Qon'ırat) | 54 | Karakalpakstan |
59 | 43 | 0.91 | 3.17 | 1.003 |
0.28 | 2.35 |
| Qazaqs | 50 | Karakalpakstan |
63 | 44 | 0.85 | 2.36 | 1.004 |
0.16 | 2.78 |
| Qazaqs | 38 | Almaty, KatonKaragay, Karatutuk,
Rachmanovsky Kluchi, Kazakhstan |
68 | 42 | 0.78 | 2.86 | 1.004 |
0.26 | 2.71 |
| Qazaqs | 49 | South-east Kazakhstan |
77 | 40 | 0.69 | 1.56 | 1.012 |
0.22 | 3.06 |
| Kyrgyz | 41 | Central Kyrgyzstan (Mixed) |
74 | 41 | 0.88 | 2.47 | 1.004 |
0.41 | 1.86 |
| Kyrgyz (Sary-Tash) | 43 | South Kyrgyzstan, Pamirs |
73 | 40 | 0.45 | 1.30 | 1.003 |
0.12 | 4.78 |
| Kyrgyz (Talas) | 41 | North Kyrgyzstan |
72 | 42 | 0.94 | 3.21 | 1.002 |
0.39 | 1.78 |
| Mongolians | 65 | Ulaanbaatar, Mongolia |
90 | 49 | 0.96 | 3.37 | 1.009 |
0.38 | 1.81 |
| Turkmen | 51 | Uzbekistan/Turkmenistan border |
59 | 42 | 0.67 | 1.84 | 1.006 |
0.27 | 3.00 |
| Turkmen | 21 | Ashgabat, Turkmenistan |
59 | 40 | 0.89 | 3.34 | 1.006 |
0.48 | 1.62 |
| Dungans | 22 | Alexandrovka and Osh, Kyrgyzstan |
78 | 41 | 0.99 | 4.13 | 1.005 |
0.82 | 1.10 |
| Kurds | 20 | Bagyr, Turkmenistan |
59 | 39 | 0.99 | 3.59 | 1.009 |
0.80 | 1.11 |
| Uighurs | 33 | Almaty and Lavar, Kazakhstan |
79 | 42 | 0.99 | 3.72 | 1.007 |
0.67 | 1.22 |
| Uighurs | 39 | South East Kazakhstan |
79 | 43 | 0.99 | 3.79 | 1.008 |
0.77 | 1.15 |
| Uzbeks (North) | 40 | Karakalpakstan |
60 | 43 | 0.96 | 3.42 | 1.005 |
0.48 | 1.54 |
| Uzbeks (South) | 28 | Kashkadarya, Uzbekistan |
66 | 40 | 1.00 | 3.53 | 1.008 |
0.93 | 1.04 |
| Tajiks (Yagnobi) | 22 | Penjikent, Tajikistan |
71 | 39 | 0.87 | 2.69 | 1.012 |
0.45 | 1.69 |
Key: the pastoral populations are in the grey area; the farmer populations are in the white area.
This table also includes the sample size, n, and longitude and latitude of the population sampled, as well as the heterozygosity, H, the mean
number of pairwise differences, π, the proportion of singletons, Ps, and the mean number of individuals carrying the same Y STR haplotype, C.
In addition it includes a statistical computation of the demographic growth rate, r.
In contrast to the results obtained from the mtDNA analysis, both the heterozyosity and the mean pairwise differences computed from the Y chromosome
STRs were significantly lower in the pastoral populations than in the farmer populations. Thus Y chromosome diversity has been lost in the pastoral
populations.
Conversely calculations of the genetic distance, Rst, between each of the two groups of populations showed that pastoral populations were more
highly differentiated than farmer populations. The supplemental data given online demonstrates that this is not as a result of geographic distance,
there being no perceived correlation between genetic and geographic distance in both population groups.
Finally the rate of demographic growth was found to be lower in pastoral than in farmer populations.
Interpretation
At first sight the results are counter-intuitive. One would expect that the diversity of mtDNA in pastoral societies would be higher than in
farming societies, because the men in those societies are marrying brides who contribute mtDNA from clans other than their own.
Similarly one would expect no great difference in Y chromosome diversity between pastoralists and farmers because both societies are patrilinear.
Leaving aside the matter of immigration, the males who contribute the Y chromosome are always selected from the local sampled population.
To understand the results, Chaix et al investigated the distribution of genetic diversity within individual populations using a statistical
technique called multi-dimensional scaling analysis or MDS. This attempts to sort or resolve a sample into its different component parts, illustrating
the results in two dimensions.
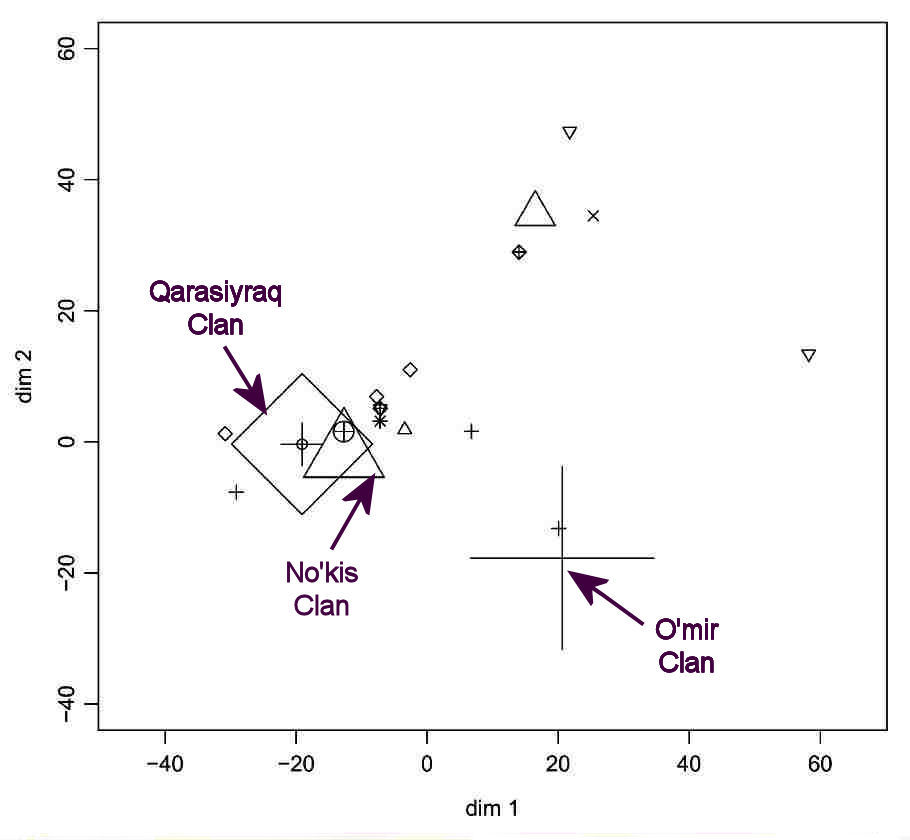
The example chosen in the paper focuses on the Karakalpak On To'rt Urıw arıs. The MDS analysis of the Y chromosome data
resolves the sample of 54 individuals into clusters, each of whom have exactly the same STR haplotypes:
Multidimensional Scaling Analysis based on the Matrix of Distance between Y STR Haplotypes
in a Specific Pastoral Population: the Karakalpak On To'rt Urıw.
Thus the sample contains 13 individuals from the O'mir clan of the Keneges tribe with the same haplotype (shown by the large cross), 10 individuals
of the Qarasıyraq clan of the Man'g'ıt tribe with the same haplotype (large diamond), and 10 individuals from the No'kis clan of the Keneges
tribe with the same haplotype (large triangle). Other members of the same clans have different haplotypes, as shown on the chart. Those close to the
so-called "identity core" group may have arisen by mutation. Those further afield might represent immigrants or adoptions.
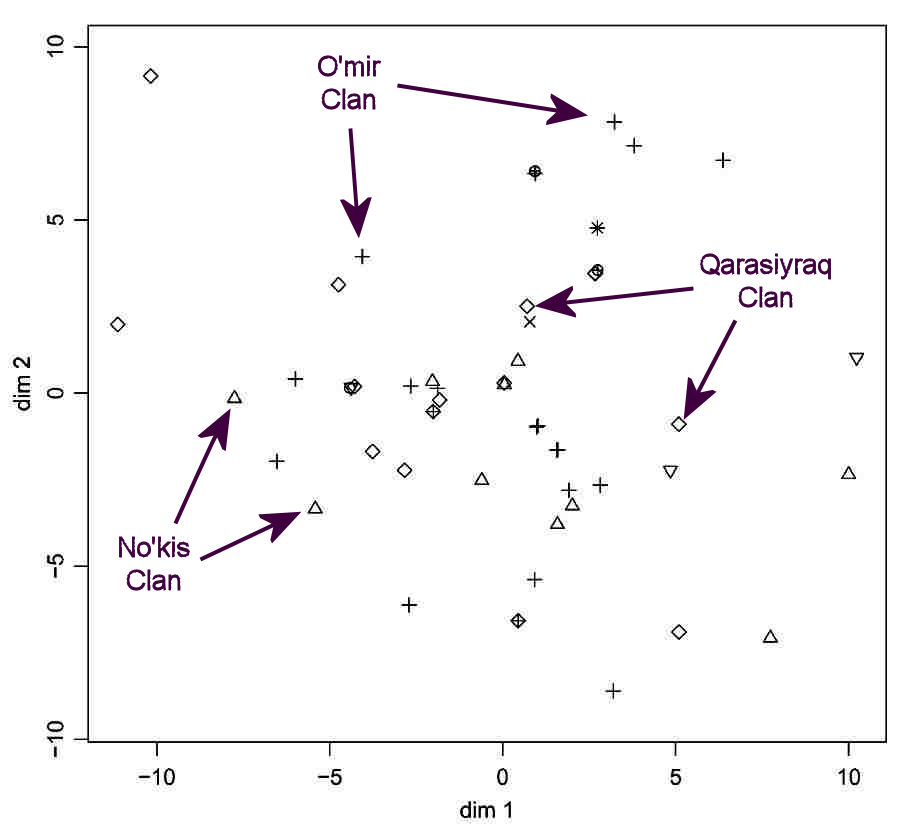
No such clustering is observed following the MDS analysis of the mtDNA data for the same On To'rt Urıw arıs:
Multidimensional Scaling Analysis based on the Number of Differences between the Mitochondrial Sequence
in the Same Pastoral Population: the Karakalpak On To'rt Urıw.
Every individual in the sample, including those from the same clan, has a different HVS-1 sequence.
Similar MDS analyses of the different farmer populations apparently showed very few "identity cores" in the Y chromosome data and a total absence
of clustering in the mtDNA data, just as in the case of the On To'rt Urıw.
The overall conclusion was that the existence of "identity cores" was specific to the Y chromosome data and was mainly restricted to the pastoral
populations. This is reflected in the tables above, where we can see that the mean number of individuals carrying the same mtDNA sequence ranges
from about 1 to 1½ and shows no difference between pastoral and farming populations. On the other hand the mean number of individuals carrying
the same STR haplotype is low for farming populations but ranges from 1½ up to almost 5 for the pastoralists. Pastoral populations also have
a lower number of Y chromosome singletons.
Chaix et al point to three reinforcing factors to explain the existence of "identity cores" in pastoral as opposed to farming populations:
- pastoral lineages frequently split and divide with closely related men remaining in the same sub-group, thereby reducing Y chromosome diversity,
- small populations segmented into lineages can experience strong genetic drift, creating high frequencies of specific haplotypes, and
- random demographic uncertainty in small lineage groups can lead to the extinction of some haplotypes, also reducing diversity.
Together these factors reduce overall Y chromosome diversity.
To explain the similar levels of mtDNA diversity in pastoral and farmer populations, Chaix et al point to the complex rules connected with
exogamy. Qazaq men for example must marry a bride who has not had an ancestor belonging to the husband's own lineage for at least 7 generations,
while Karakalpak men must marry a bride from another clan, although she can belong to the same tribe. Each pastoral clan, therefore, is gaining
brides (and mtDNA) from external clans but is losing daughters (and mtDNA) to external clans. Such continuous and intense migration reduces mtDNA
genetic drift within the clan. This in turn lowers diversity to a level similar to that observed in farmer populations, which is in any event
already high. The process of two-way female migration effectively isolates the mtDNA structure of pastoral societies from their social structure.
One aspect overlooked by the study is that, until recent times, Karakalpak clans were geographically isolated in villages located in specific parts
of the Aral delta and therefore tended to always intermarry with one of their adjacent neighbouring clans.
In effect, the two neighbouring clans behaved like a single population, with females moving between clans in every generation. How such social
behaviour affected genetic structure was not investigated.
Uzbeks
The Uzbeks were traditionally nomadic pastoralists and progressively became settled agricultural communities from the 16th century onwards. The
survey provided an opportunity to investigate the effect of this transition in lifestyle on the genetic structure of the Uzbek Y chromosome.
Table 2 above shows that the genetic diversity found among Uzbeks, as measured by heterozygosity and the mean number of pairwise differences,
was similar to that of the other farmer populations, as was the proportion of singleton haplotypes. Equally the mean number of individuals carrying
the same Y STR haplotype was low (1 to 1½), indicating an absence of the haplotype clustering (or "identity cores") observed in pastoral
populations. The pastoral "genetic signature" must have been rapidly eroded, especially in the case of the northern Uzbeks from Karakalpakstan,
who only settled from the 17th century onwards.
Two reasons are proposed for this rapid transformation. Firstly the early collapse and integration of the Uzbek descent groups following their
initial settlement and secondly their mixing with traditional Khorezmian farming populations, which led to the creation of genetic admixtures of
the two groups.
Addendum
Of course the Karakalpak On To'rt Urıw have been settled farmers for just as long as many Khorezmian Uzbeks and cannot in any way be strictly
described as pastoralists. Indeed the majority of Karakalpak Qon'ırats have also been settled for much of the 20th century. However both
have strictly maintained their traditional pastoralist clan structure and associated system of exogamous marriage. So although their lifestyles have
changed radically , their social behaviour to date has not.
Discussion and Conclusions
The Karakalpaks and their Uzbek and Qazaq neighbours have no comprehensive recorded history, just occasional historical reports coupled
with oral legends which may or may not relate to certain historical events in their past. We therefore have no record of where or when the
Karakalpak confederation emerged and for what political or other reasons.
In the absence of solid archaeological or historical evidence, many theories have been advanced to explain the origin of the Karakalpaks.
Their official history, as taught in Karakalpak colleges and schools today, claims that the Karakalpaks are the descendants of the original
endemic nomadic population of the Khorezm oasis, most of whom were forced to leave as a result of the Mongol invasion in 1221 and the
subsequent dessication of the Aral delta following the devastation of Khorezm by Timur in the late 14th century, only returning in
significant numbers during the 18th century. We fundamentally disagree with this simplistic picture, which uncritically endures with high-
ranking support because it purports to establish an ancient Karakalpak origin and justifies tenure of the current homeland.
While population genetics cannot unravel the full tribal history of the Karakalpaks per se, it can give us important clues to
their formation and can eliminate some of the less likely theories that have been proposed.
The two arıs of the Karakalpaks, the Qon'ırat and the On To'rt Urıw, are very similar to each other genetically, especially in the
male line. Both are equally close to the Khorezmian Uzbeks, their southern neighbours. Indeed the genetic distances between the different
populations of Uzbeks scattered across Uzbekistan is no greater than the distance between many of them and the Karakalpaks. This
suggests that Karakalpaks and Uzbeks have very similar origins. If we want to find out about the formation of the Karakalpaks we should
look towards the emergence of the Uzbek (Shaybani) Horde and its eastwards migration under the leadership of Abu'l Khayr, who united much
of the Uzbek confederation between 1428 and 1468.
Like the Uzbeks, the Karakalpaks are extremely diverse genetically. One only has to spend time with them to realize that some look European,
some look Caucasian, and some look typically Mongolian. Their DNA turns out to be an admixture, roughly balanced between eastern and
western populations. Two of their main genetic markers have far-eastern origins, M9 being strongly linked to Chinese and other Far Eastern
peoples and M130 being linked to the Mongolians and Qazaqs. On the other hand, M17 is strong in Russia, the Ukraine, and Eastern Europe,
while M89 is strong in the Middle East, the Caucasus, and Russia. M173 is strong in Western Europe and M45 is believed to have originated
in Central Asia, showing that some of their ancestry goes back to the earliest inhabitants of that region. In fact the main difference
between the Karakalpaks and the Uzbeks is a slight difference in the mix of the same markers. Karakalpaks have a somewhat greater bias
towards the eastern markers. One possible cause could be the inter-marriage between Karakalpaks and Qazaqs over the past 400 years, a theory
that gains some support from the close similarities in the mitochondrial DNA of the neighbouring female Karakalpak Qon'ırat and Qazaqs
of the Aral delta.
After the Uzbeks, Karakalpaks are next closest to the Uighurs, the Crimean Tatars, and the Kazan Tatars, at least in the male line. However
in the female line the Karakalpaks are quite different from the Uighurs and Crimean Tatars (and possibly from the Kazan Tatars as well).
There is clearly a genetic link with the Tatars of the lower Volga through the male line. Of course the Volga region has been closely linked
through communications and trade with Khorezm from the earliest days.
The Karakalpaks are genetically distant from the Qazaqs and the Turkmen, and even more so from the Kyrgyz and the Tajiks. We know that the
Karakalpaks were geographically, politically, and culturally very close to the Qazaqs of the Lesser Horde prior to their migration into
the Aral delta and were even once ruled by Qazaq tribal leaders. From their history, therefore, one might have speculated that the Karakalpaks
may have been no more than another tribal group within the overall Qazaq confederation. This is clearly not so. The Qazaqs have a quite
different genetic history, being far more homogenous and genetically closer to the Mongolians of East Asia. However as we have seen, the
proximity of the Qazaqs and Karakalpaks undoubtedly led to intermarriage and therefore some level of genetic exchange.
Karakalpak Y chromosome polymorphisms show different patterns from mtDNA polymorphisms in a similar manner to that identified in certain
other Central Asian populations. This seems to be associated with the Turkic traditions of exogamy and so-called patrilocal marriage.
Marriage is generally not permissible between couples belonging to the same clan, so men must marry women from other clans, or tribes, or
in a few cases even different ethnic groups. After the marriage the groom stays in his home village and his bride moves from her village
to his. The result is that the male non-recombining part of the Y chromosome becomes localized as a result of its geographical isolation,
whereas the female mtDNA benefits from genetic mixing as a result of the albeit short range migration of young brides from different clans
and tribes.
One of the most important conclusions is the finding that clans within the same tribe show no sign of genetic kinship, whether the tribe
concerned is Karakalpak, Uzbek, Qazaq, or Turkmen. Indeed among the most settled ethnic groups, the Uzbeks and Karakalpak On To'rt Urıw,
there is very little kinship even at clan level. It seems that settled agricultural communities soon lose their strong tribal identity and
become more openminded to intermarriage with different neighbouring ethnic groups. Indeed the same populations place less importance on their
geneaology and no longer maintain any identity according to lineage.
It has generally been assumed that most Turkic tribal groups like the Uzbeks were formed as confederations of separate tribes and this is
confirmed by the recent genetic study of ethnic groups from Karakalpakstan. We now see that this extends to the tribes themselves, with an
absence of any genetic link between clans belonging to the same tribe. Clearly they too are merely associations of disparate groups, formed
because of some historical reason other than descent. Possible causes for such an association of clans could be geographic or economic, such
as common land use or shared water rights; military, such as a common defence pact or the construction of a shared qala; or perhaps political,
such as common allegiance to a strong tribal leader.
The history of Central Asia revolves around migrations and conflicts and the formation, dissolution, and reformation of tribal confederations,
from the Saka Massagetae and the Sarmatians, to the Oghuz and Pechenegs, the Qimek, Qipchaq, and Karluk, the Mongols and Tatars, the White and
Golden Hordes, the Shaybanid and Noghay Hordes, and finally the Uzbek, Qazaq, and Karakalpak confederations. Like making cocktails from
cocktails, the gene pool of Central Asia was constantly being scrambled, more so on the female line as a result of exogamy and patrilineal
marriage.
The same tribal and clan names occur over and over again throughout the different ethnic Qipchaq-speaking populations of Central Asia,
but in different combinations and associations. Many of the names predate the formation of the confederations to which they now belong,
relating to earlier Turkic and Mongol tribal factions. Clearly tribal structures are fluid over time, with some groups withering or
being absorbed by others, while new groups emerge or are added.
When Abu'l Khayr Sultan became khan of the Uzbeks in 1428-29, their confederation consisted of at least 24 tribes, many with smaller
subivisions. The names of 6 of those tribes occur among the modern Karakalpaks. A 16th century list, based on an earlier document,
gives the names of 92 nomadic Uzbek tribes, at least 20 of which were shared by the later breakaway Qazaqs. 13 of the 92 names also
occur among the modern Karakalpaks.
Shortly after his enthronement as the Khan of Khorezm in 1644-45, Abu'l Ghazi Khan reorganized the tribal structure of the local Uzbeks
into four tüpe:
| Tüpe | Main Tribes | Secondary Tribes |
Karakalpak
Arıs | Karakalpak
Tribes | Karakalpak
Clans |
| 1 | Qangli
Qipchaq | On Tort Urugh | On To'rt Urıw | Qan'glı
Qıpshaq | |
| 2 | Manghit
Nokuz | Keneges
Khoja-eli | | Man'g'ıt
Keneges | No'kis |
| 3 | Qonghrat
Qiyat | Jalayir
Ali-eli | Qon'ırat | Qıyat | |
| 4 | Uighur
Nayman | Durman, Yüz, Ming
Shaykhs, Burlaqs, Arabs | | | Uyg'ır |
8 out of the 11 tribal names associated with the first three tüpe are also found within the Karakalpak tribal structure.
Clearly there is greater overlap between the Karakalpak tribes and the local Khorezmian Uzbek tribes than in the Uzbek tribes in general.
The question is whether these similarities pre-dated the Karakalpak migration into the Aral delta or are a result of later Uzbek influences?
We know that the Qon'ırat were a powerful tribe in Khorezm for Uzbeks and Karakalpaks alike. They were mentioned as one of the Karakalpak
"clans" on the Kuvan Darya [Quwan Darya] by Gladyshev in 1741 along with the Kitay, Qipchaq, Kiyat, Kinyagaz-Mangot (Keneges-Man'g'ıt), Djabin, Miton,
and Usyun. Munis recorded that Karakalpak Qon'ırat, Keneges, and Qıtay troops supported Muhammad Amin Inaq against the Turkmen in 1769.
Thanks to Sha'rigu'l Payzullaeva we have a comparison of the Qon'ırat tribal structure in the Aral Karakalpaks, the Surkhandarya Karakalpaks,
and the Khorezmian Uzbeks, derived from genealogical records:
The different status of the same Qon'ırat tribal groups among the Aral and Surkhandarya Karakalpaks and the Khorezmian Uzbeks
| Tribal Group | Aral
Karakalpaks |
Surkhandarya
Karakalpaks | Khorezmian
Uzbeks |
| Ashamaylı | tribe | clan | tube |
| Baymaqlı | clan | clan | |
| Taraqlı | clan | clan | |
| Qazayaqlı | clan | clan | tube |
| Sho'mishlı | clan | clan | |
| Ishchiqli | tiıre | clan | clan |
| Balg'alı | tribe | clan | tube |
| Bu'gejeyli | | clan | clan |
| Qandeklı | tribe | clan | clan |
| Irg'aqlı | clan | clan | clan |
| Qostamg'alı | clan | branch of tribe | |
| Qanjıg'alı | tiıre | branch of tribe | tube |
| Shu'llik | division of arıs | clan | |
| Qoldawlı | tribe | clan | |
| Tu'rkmen | clan | clan | |
| Tartıwlı | tiıre | branch of tribe | clan |
| Sıyraq | clan | branch of clan | |
| Tog'ız | tiıre | clan | clan |
| Qaramoyın | tribe | branch of clan | |
A tube is a branch of a tribe among the Khorezmian Uzbeks and a tiıre is a branch of a
clan among the Aral Karakalpaks.
The Karakalpak enclave in Surkhandarya was already established in the first half of the 18th century, some Karakalpaks fleeing
to Samarkand and beyond following the devastating Jungar attack of 1723. Indeed it may even be older - the Qon'ırat have a
legend that they came to Khorezm from the country of Zhideli Baysun in Surkhandarya. This suggests that some Karakalpaks had
originally travelled south with factions from the Shaybani Horde in the early 16th century. The fact that the Karakalpak
Qon'ırats remaining in that region have a similar tribal structure to the Khorezmian Uzbeks is powerful evidence that the tribal
structure of the Aral Karakalpaks had broadly crystallized prior to their migration into the Aral delta.
The Russian ethnographer Tatyana Zhdanko was the first academic to make an in-depth study of Karakalpak tribal structure. She
not only uncovered the similarities between the tribal structures of the Uzbek and Karakalpak Qon'ırats in Khorezm but also the
closeness of their respective customs and material and spiritual cultures. She concluded that one should not only view the
similarity between the Uzbek and Karakalpak Qon'ırats in a historical sense, but should also see the commonality of their present-
day ethnic relationships. B. F. Choriyev added that "this kind of similarity should not only be sought amongst the Karakalpak
and the Khorezmian Qon'ırats but also amongst the Surkhandarya Qon'ırats. They all have the same ethnic history."
Such ethnographic studies provide support to the findings that have emerged from the recent studies of Central Asian genetics.
Together they point towards a common origin of the Karakalpak and Uzbek confederations. They suggest that each was formed out of
the same melange of tribes and clans inhabiting the Dasht-i Qipchaq following the collapse of the Golden Horde, a vast expanse
ranging northwards from the Black Sea coast to western Siberia and then eastwards to the steppes surrounding the lower and middle
Syr Darya, encompassing the whole of the Aral region along the way.
Of course the study of the genetics of present-day populations gives us the cumulative outcome of hundreds of thousands of years of
complex human history and interaction. We now need to establish a timeline, tracking genetic changes in past populations using the
human skeletal remains retrieved from Saka, Sarmatian, Turkic, Tatar, and early Uzbek and Karakalpak archaeological burial sites. Such
studies might pinpoint the approximate dates when important stages of genetic intermixing occurred.
Postscript
Sha'rigu'l Payzullaeva recalls an interesting encounter at the Regional Studies Museum in No'kis during the month of August 1988. Thirty-eight
elderly men turned up together to visit the Museum. Each wore a different kind of headdress, some with different sorts of taqıya,
others with their heads wrapped in a double kerchief. They introduced themselves as Karakalpaks from Jarqorghan rayon in Surkhandarya
viloyati, just north of the Afghan border. One of them said "Oh daughter, we are getting old now. We decided to come here to see our
homeland before we die."
During their visit to the Museum they said that they would travel to Qon'ırat rayon the following day. Sha'rigu'l was curious to know why
they specifically wanted to visit Qon'ırat. They explained that it was because most of the men were from the Qon'ırat clan.
One of the men introduced himself to Sha'rigu'l: "My name is Mirzayusup Khaliyarov, the name of my clan is Qoldawlı. After discovering that
Sha'rigu'l was also Qoldawlı his eyes filled with tears and he kissed her on the forehead.
References
Bowles, G. T., The People of Asia, Weidenfeld and Nicolson, London, 1977.
Comas, D., Calafell, F., Mateu, E., Pérez-Lezaun, A., Bosch, E., Martínez-Arias, R., Clarimon, J., Facchini, F.,
Fiori, G., Luiselli, D., Pettener, D., and Bertranpetit, J., Trading Genes along the Silk Road: mtDNA Sequences and
the Origin of Central Asian Populations, American Journal of Human Genetics, 63, pages 1824 to 1838, 1998.
Cavalli-Sforza, L. L., Menozzi, P., and Piazza, A., The History and Geography of Human Genes, Princeton University Press,
Princeton, 1994.
Chaix, R., Austerlitz, F., Khegay, T., Jacquesson, S., Hammer, M. F., Heyer, E., and Quintana-Murci, L., The Genetic or
Mythical Ancestry of Descent Groups: Lessons from the Y Chromosome, American Journal of Human Genetics, Volume 75, pages
1113 to 1116, 2004.
Chaix, R., Quintana-Murci, L., Hegay, T., Hammer, M. F., Mobasher, Z., Austerlitz, F., and Heyer, E., From Social to Genetic
Structures in Central Asia, Current Biology, Volume 17, Issue 1, pages 43 to 48, 9 January 2007.
Comas, D., Plaza, S., Spencer Wells, R., Yuldaseva, N., Lao, O., Calafell, F., and Bertranpetit, J., Admixture, migrations,
and dispersals in Central Asia: evidence from maternal DNA lineages, European Journal of Human Genetics, pages 1 to 10, 2004.
Heyer, E., Central Asia: A common inquiry in genetics, linguistics and anthropology, Presentation given at the conference
entitled "Origin of Man, Language and Languages", Aussois, France, 22-25 September, 2005.
Heyer, E., Private communications to the authors, 14 February and 17 April, 2006.
Krader, L., Peoples of Central Asia, The Uralic and Altaic Series, Volume 26, Indiana University, Bloomington, 1971.
Passarino, G., Semino, O., Magri, C., Al-Zahery, N., Benuzzi, G., Quintana-Murci, L., Andellnovic, S., Bullc-Jakus, F., Liu, A.,
Arslan, A., and Santachiara-Benerecetti, A., The 49a,f Haplotype 11 is a New Marker of the EU19 Lineage that Traces Migrations
from Northern Regions of the Black Sea, Human Immunology, Volume 62, pages 922 to 932, 2001.
Payzullaeva, Sh., Numerous Karakalpaks, many of them! [in Karakalpak], Karakalpakstan Publishing, No'kis, 1995.
Pérez-Lezaun, A., Calafell, F., Comas, D., Mateu, E., Bosch, E., Martínez-Arias, R., Clarimón, J., Fiori, G.,
Luiselli, D., Facchini, F., Pettener, D., and Bertranpetit, J., Sex-Specific Migration Patterns in Central Asian Populations,
Revealed by Analysis of Y-Chromosome Short Tandem Repeats and mtDNA, American Journal of Human Genetics, Volume 65, pages 208
to 219, 1999.
Spencer Wells, R., The Journey of Man, A Genetic Odyssey, Allen Lane, London, 2002.
Spencer Wells, R., et al, The Eurasian Heartland: A continental perspective on Y-chromosome diversity, Proceedings
of the National Academy of Science, Volume 98, pages 10244 to 10249, USA, 28 August 2001.
Underwood, J. H., Human Variation and Human Micro-Evolution, Prentice-Hall Inc., New Jersey, 1979.
Underwood, P. A., et al, Detection of Numerous Y Chromosome Biallelic Polymorphisms by Denaturing High-Performance
Liquid Chromatography, Genome Research, Volume 7, pages 996 to 1005, 1997.
Zerjal, T., Spencer Wells, R., Yuldasheva, N., Ruzibakiev, R., and Tyler-Smith, C., A Genetic Landscape Reshaped by Recent
Events: Y Chromosome Insights into Central Asia, American Journal of Human Genetics, Volume 71, pages 466 to 482, 2002.
Visit our sister site www.qaraqalpaq.com, which uses the correct transliteration, Qaraqalpaq, rather than the
Russian transliteration, Karakalpak.
Return to top of page
Home Page
|
|